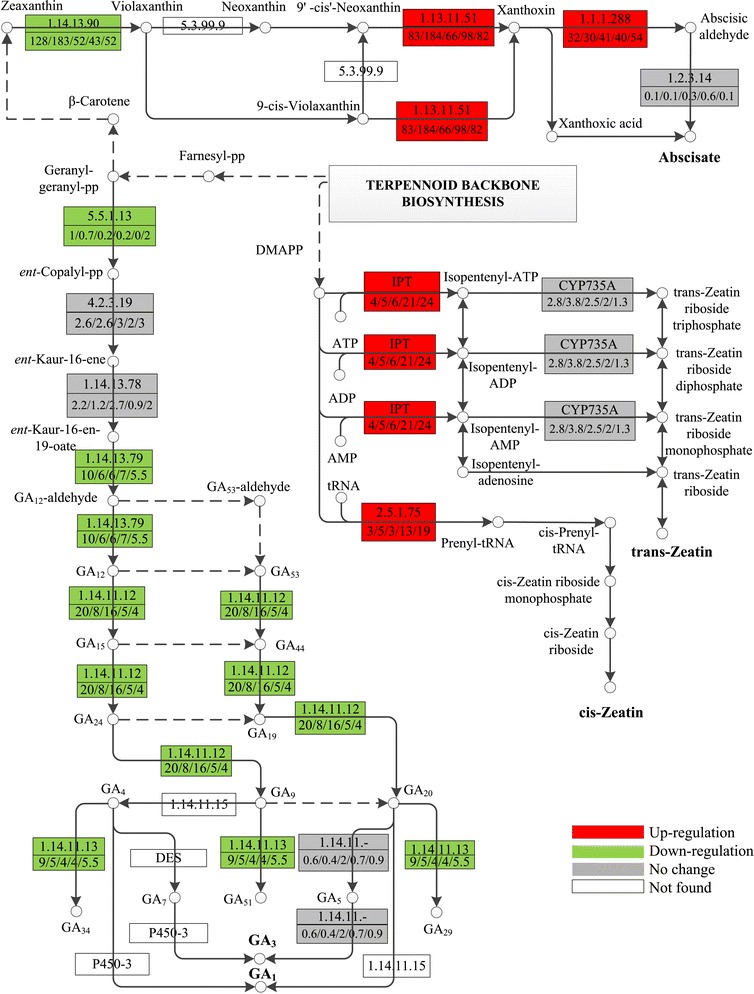
Figure 5.

Expression patterns of Zeatin, abscisic acid (ABA), and gibberellins (GAs) metabolism related transcripts. Expression alterations of Zeatin, ABA, and GA metabolism-related transcripts are displayed in the simplified metabolism pathway. Red boxes indicate the up-regulated enzymes, green means down-regulated enzymes, gray means no significant difference were observed, and white means this enzyme was not found in this study. The numbers in the upper half of the boxes correspond to the EC numbers and the numbers in the lower half, separated by slashes, correspond to the expression levels of these enzymes shown in FPKM at 0, 2, 5, 72, and 240 h, respectively. 2.5.1.27, adenylate isopentenyltransferase; IPT, adenylate isopentenyltransferase; CYP735A, cytokinin trans-hydroxylase; 1.14.13.90, zeaxanthin epoxidase; 1.13.11.51, 9-cis-epoxycarotenoid dioxygenase; 1.2.3.14, abscisic-aldehyde oxidase; 1.1.1.288, xanthoxin dehydrogenase; 5.5.1.13, ent-copalyl diphosphate synthase; 4.2.3.19, ent-kaurene synthase; 1.14.13.78, ent-kaurene oxidase; 1.14.13.79, ent-kaurenoic acid hydroxylase; 1.14.11.12, gibberellin 20-oxidase; 1.14.11.13, gibberellin 2-oxidase.
