
Figure 3.
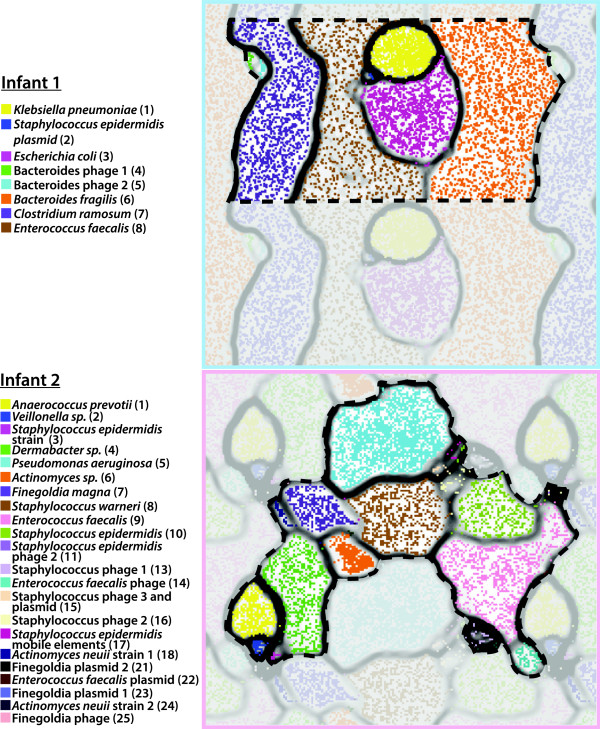
Time-series coverage emergent self-organizing maps (ESOMs) reveal discrete genome bins for each infant’s dataset. The underlying ESOMs are shown in a tiled display with each data point colored by its taxonomic assignment. Labels to the left are colored to match their respective data points and numbers in parentheses correspond to the bin numbers in Table 4.