
Figure 4.
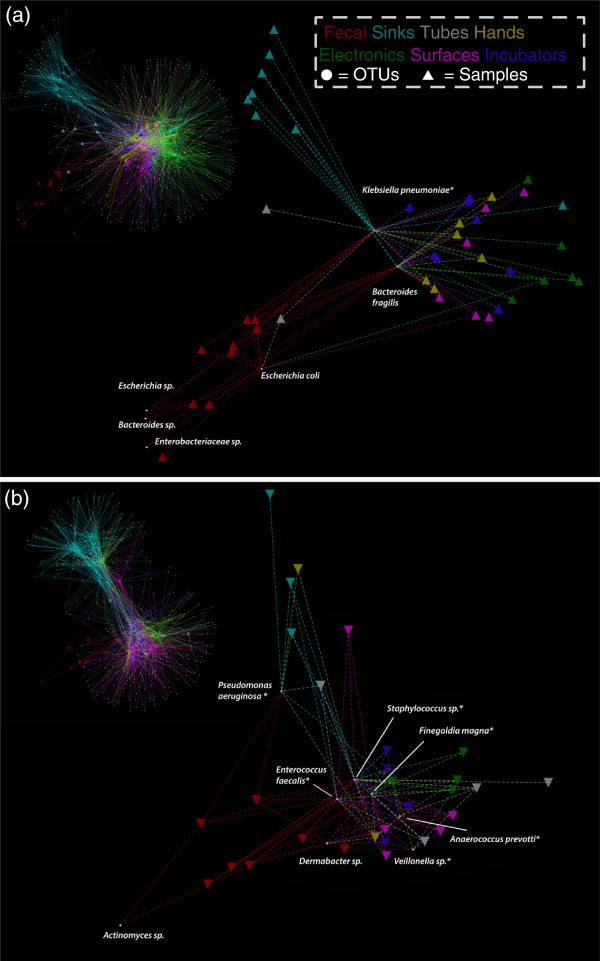
Spring-weighted edge-embedded network plots of room and fecal operational taxonomic units (OTUs). Found in two or more samples (infant 1 (a), infant 2 (b)). Left, the entire network is displayed. To better visualize the distribution of gut colonizers across room samples, only room samples sharing fecal OTUs are shown in the excerpt (right). Triangles represent samples and circles represent OTUs. The spring weight is derived from ‘expectation maximization iterative reconstruction of genes from the environment’ (EMIRGE) generated abundances and edges are colored by environment type. Each OTU has a taxonomic label and asterisks indicate OTUs detected in room samples before detection in the gut.