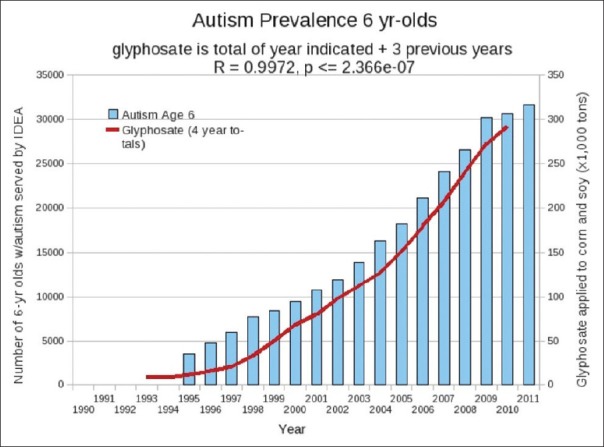
Figure 1.

Plots of amount of glyphosate applied to corn and soy crops in the US over the previous 4 years (red), provided by the US Department of Agriculture, compared with number of children enrolled in the first grade in the public school system under the autism category according to the Individuals with Disabilities Education Act (IDEA) (blue bars). (Figure courtesy of Dr. Nancy Swanson)
