
Figure 3.
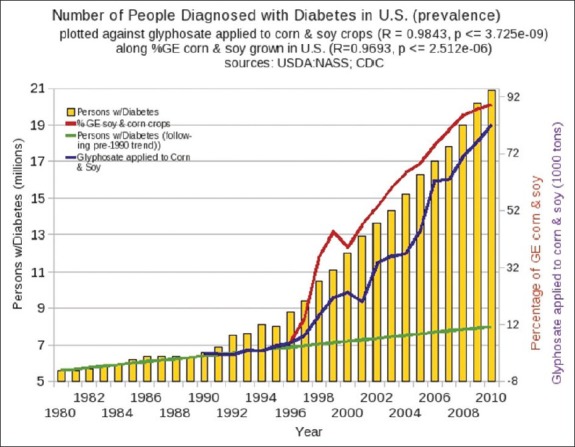
Plots of glyphosate usage on corn and soy crops (blue), percent of corn and soy that is genetically engineered to be “Roundup Ready” (red), and prevalence of diabetes (yellow bars) in the US. (Figure courtesy of Dr. Nancy Swanson)
Official websites use .gov
A
.gov website belongs to an official
government organization in the United States.
Secure .gov websites use HTTPS
A lock (
) or https:// means you've safely
connected to the .gov website. Share sensitive
information only on official, secure websites.
Plots of glyphosate usage on corn and soy crops (blue), percent of corn and soy that is genetically engineered to be “Roundup Ready” (red), and prevalence of diabetes (yellow bars) in the US. (Figure courtesy of Dr. Nancy Swanson)