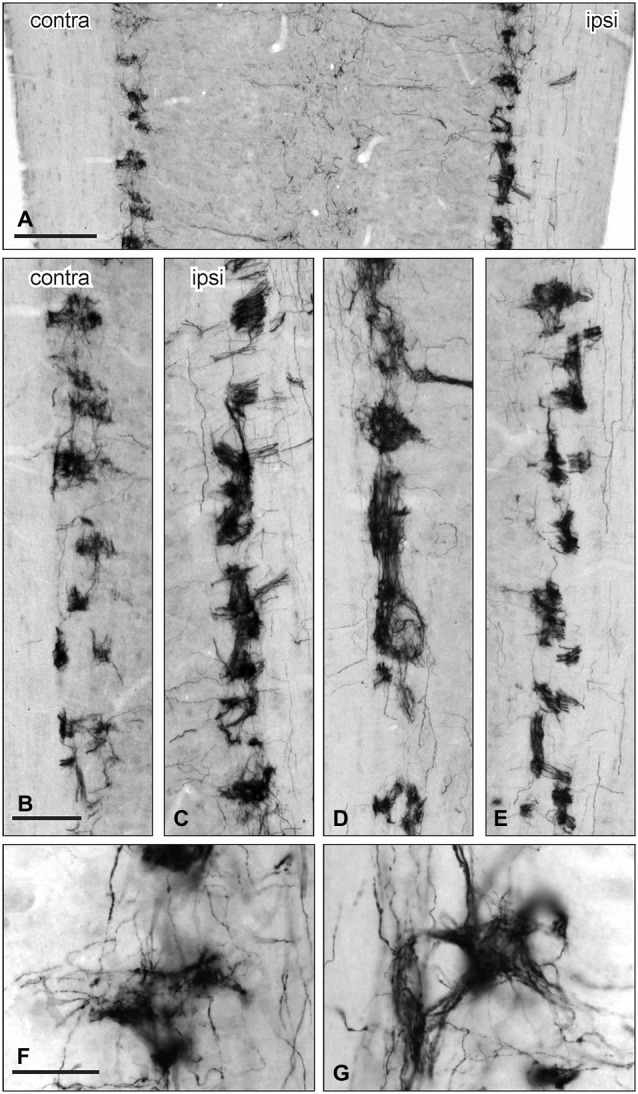
Figure 7.

Distribution of GFRα3-IR in the sacral parasympathetic nucleus (SPN) viewed in horizontal sections following pelvic nerve transection. (A–C) Asymmetric upregulation of GFRα3-IR in the SPN ipsilateral to a unilateral pelvic nerve transection . (D,E): Symmetric upregulation GFRα3-IR in the SPN on both sides following bilateral pelvic nerve transection. (F,G) GFRα3-IR axons formed dense clusters in the SPN but labeling was not see in somata. Scale bars represent 200 μm (A), 50 μm (B–E) and 50 μm (F,G).
