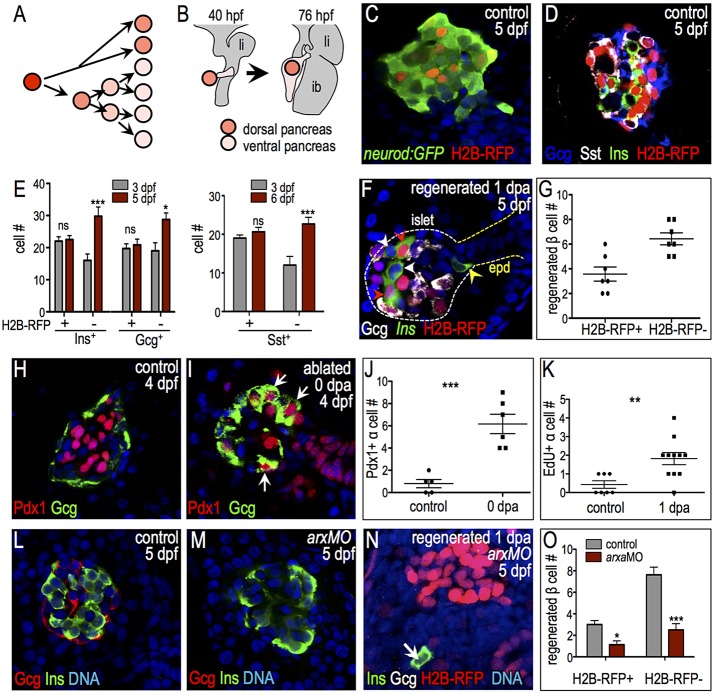
Fig. 3.
α-to-β cell transdifferentiation can be marked by the label-retaining cell (LRC) assay in the zebrafish principal islet. (A,B) Schematic of the LRC assay. (A) Zygotes were injected with H2B-RFP mRNA. Fluorescent signal from H2B-RFP protein was diluted by mitosis. (B) The LRC assay marks quiescent, early differentiated pancreatic endocrine cells derived from the dorsal bud. li, liver; ib, intestinal bulb. (C,D) Confocal planes of H2B-RFP-labeled 5-dpf islets. (C) TgBAC(neurod1:EGFP) (n=4). (D) Wild-type islet stained for insulin (green), glucagon (blue) and somatostatin (white) (n=5). (E) Quantification of H2B-RFP+ and H2B-RFP− cells expressing insulin, glucagon and somatostatin (n≥3 for all). (F) H2B-RFP-labeled regenerating islet of 5-dpf/1-dpa Tg(ins:CFP-NTR) larva stained for CFP (insulin, green) and glucagon (white). Red arrowheads indicate H2B-RFP+ regenerating β cells, white arrowheads indicate H2B-RFP− regenerating β cells in the islet, and yellow arrowhead indicates H2B-RFP− β cells in the extra-pancreatic duct region (epd). (G) Quantification of 1-dpa H2B-RFP+ and H2B-RFP− β cells (n=7). (H,I) Confocal planes showing Pdx1 (red) and glucagon (green) expression in 4-dpf non-ablated (H) and ablated (I) islets. Pdx1+ α cells are indicated by arrows. (J) Quantification of α cells expressing Pdx1 in 4-dpf non-ablated (n=5) and ablated (n=6) islets. (K) Quantification of proliferating (EdU+) α cells in 5-dpf non-ablated and 1-dpa islets (n≥7 islets examined). (L,M) Confocal planes showing glucagon (red) and insulin (green) staining in control MO-injected (L) and arxaMO-injected (M) 5-dpf larvae. Glucagon+ cells are absent from arxa morphant islets. (N) Confocal projection of arxaMO-injected 5-dpf/1-dpa Tg(ins:CFP-NTR) islet labeled with H2B-RFP lacking most β cell regeneration. Arrow indicates regenerated β cell. (O) Quantification of 1-dpa β cells in control MO-injected (gray, n=16) and arxaMO-injected (red, n=19) islets. *P≤0.05, **P≤0.01, ***P≤0.001; ns, not significant (Student's t-test in J,K; two-way ANOVA followed by Bonferroni post-test in E,O).

