Fig. 4.
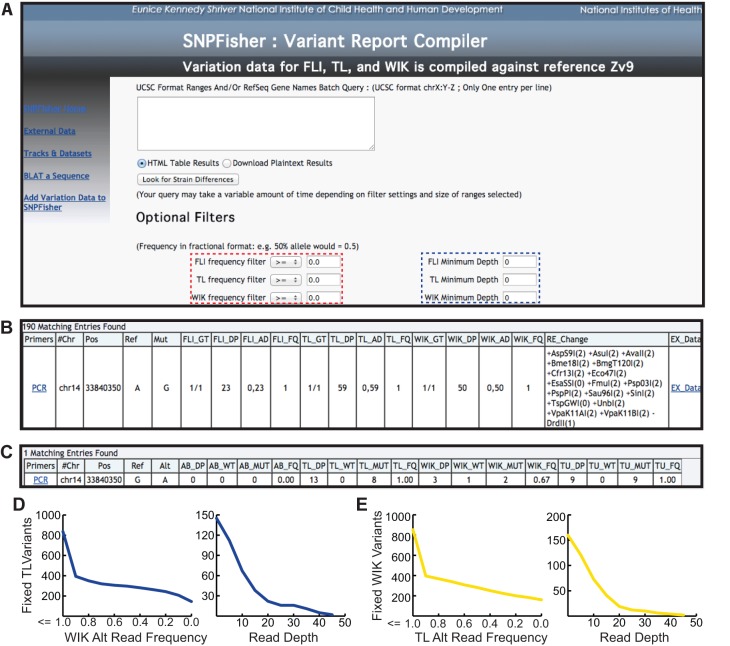
SNPfisher homepage and variant report compiler tool. (A) Screen shot of the SNPfisher homepage featuring the SNPfisher Variant Report Compiler. Users can define frequency values (dashed red box) and minimum read depth values (dashed blue box) for each strain in any gene or genomic region entered into the query box (white box in center). The drop-down filtering menus include ‘=’, ‘<’, ‘>’, ‘≤’ and ‘≥’ to adjust variant frequencies. (B) A variant annotation generated by the SNPfisher Variant Report Compiler homepage. The Primers column contains links to the ‘Primer3’ web interface to generate primers for amplification of the variant. The genotype (GT) value corresponds to genotype of the population of fish surveyed (0/0=ref. allele homozygote, 0/1=alt. allele heterozygote, 1/1=alt. allele homozygote). The allele distribution (AD) is composed of the number of ref. allele reads and then alt. allele reads separated by commas, respectively. Alt. allele read frequencies (FQ) were calculated by dividing the alt. allele reads by the total number of reads at a given position. Variants encoding RFLPs are documented in the RE_Changes column. The creation (+) or destruction (−) of a site is indicated prior to the restriction enzyme name. The number in parentheses following the restriction enzyme name indicates the number of restrictions recognition sites in the 800 bp surrounding the variant (400 bp upstream and downstream) in the Zv9 reference genome sequence. (C) An example of the variant annotation provided by the Ex_Data link in the SNPfisher report. The total read depth (DP), ref. allele read depth (WT), alt. allele read depth (MUT) and alt. allele read frequency (FQ) values represent the cumulative read sums calculated from published datasets. (D,E) Scatterplots demonstrate TL and WIK variant filtration in the cloche crucial region. The number of fixed TL variants (y-axis in left plot of D) decreases by filtering for lower alternate (Alt) allele read frequencies in WIK (x-axis). Increasing read depth (x-axis in right plot of D) decreases fixed TL variants absent in WIK (x-axis). Similar results are obtained for WIK variants in the cloche region (E).

