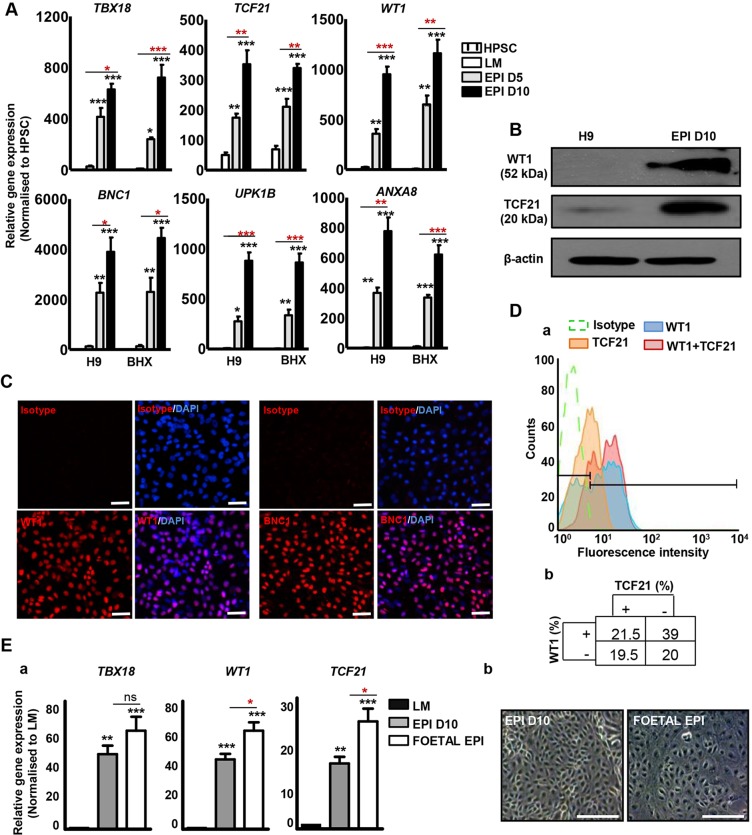
Fig. 3.
Characterisation of HPSC-derived epicardium. (A) Analysis of epicardial markers in H9 and BHX-derived epicardium-like cells by qRT-PCR. Significant differences compared with H9 are indicated in black, whereas intergroup differences are in red. ***P<0.001, **P<0.01, *P<0.05. (B) Western blot showing WT1 and TCF21 expression in H9 and H9-derived day 10 (EPI D10) epicardial cells. β-Actin was used as a loading control. (C) Immunocytochemistry for WT1 and BNC1 in EPI D10. Rabbit IgG isotype used as negative control. Scale bars: 100 μm. (D) (a) Flow cytometry analysis of WT1+, TCF21+ and WT1+/TCF21+ cells in EPI D10. Rabbit IgG isotype was used as a negative control. (b) Percentage of cells uniquely expressing WT1, TCF21 and WT1/TCF21, and cells not expressing either of the two markers. (E) (a) Expression of epicardial markers in EPI D10 and human foetal epicardial outgrowths (FOETAL EPI) by qRT-PCR. Significant differences compared with LM are in black, whereas intergroup differences are in red. ***P<0.001, **P<0.01, *P<0.05. (b) Bright-field images of EPI D10 and FOETAL EPI. Scale bars: 100 μm.

