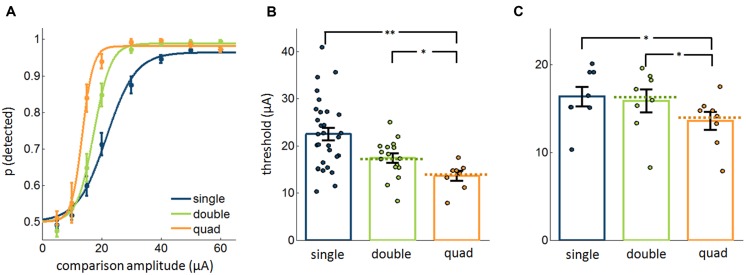
FIGURE 2.
Detectability of ICMS delivered through varying number of electrodes (20,577 trials from 54 electrodes). In these experiments, pulses occurred synchronously (Figure 1B, left). (A) Psychometric functions, averaged across single electrodes, electrode pairs, and electrode quads. (B) Measured and theoretically calculated thresholds. The bars and error bars denote the mean and SEs, respectively, and each point corresponds to a different single electrode, electrode pair, or quad. The dashed lines denote the expected threshold assuming that each electrode independently contributes to detectability. (C) Comparison of the most sensitive single electrode, best pair of electrodes, and the quad with pulses delivered synchronously in the multi-electrode conditions (9,520 trials from 24 electrodes). Error bars denote the SE of the mean. ∗p < 0.05, ∗∗p < 0.01.

