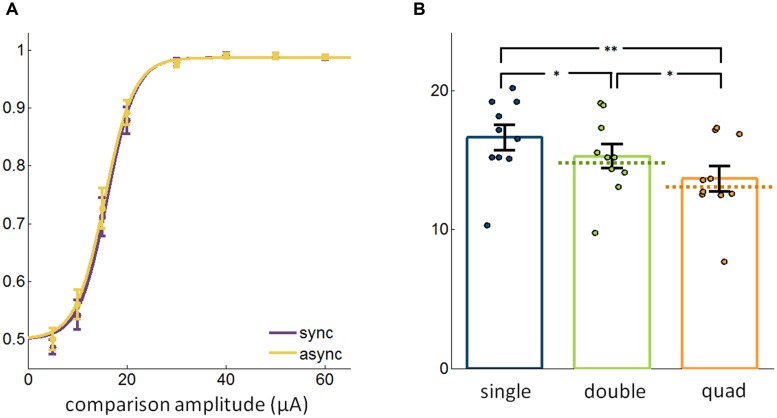
FIGURE 3.
(A) Detection performance with synchronous and asynchronous stimulation (13,202 trials from 48 electrodes). (B) Comparison of the most sensitive single electrode, best pair of electrodes, and the quad with pulses delivered asynchronously in the multi-electrode conditions (19,400 trials from 30 electrodes). Error bars denote the SE of the mean. ∗p < 0.05, ∗∗p < 0.01.

