
Figure 4.
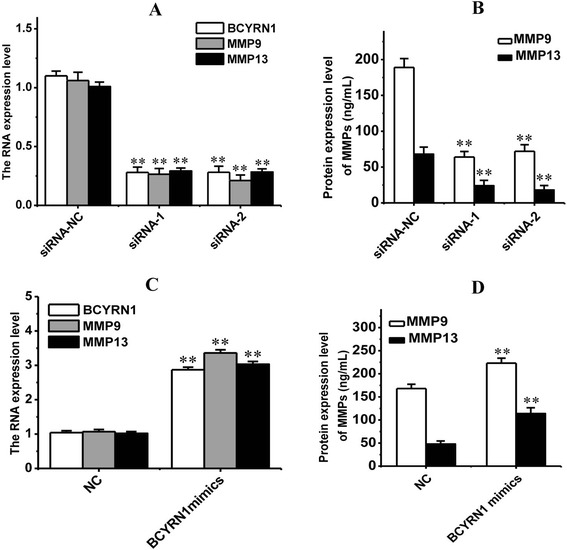
The RNA (A, C) and protein (B, D) expression levels of MMP9 and MMP13 were both downregulated by BCYRN1 inhibition, and upregulated by BCYRN1 mimics. siRNA-NC: siRNA negative control; siRNA-1: siRNA-BCYRN1-1; siRNA-2: siRNA-BCYRN1-2; NC: negative control for BCYRN1 mimics, only treated with Lipofectamine 2000. * p < 0.01, indicated a significant difference; ** p < 0.01, indicated a very significant difference, compared with negative control.