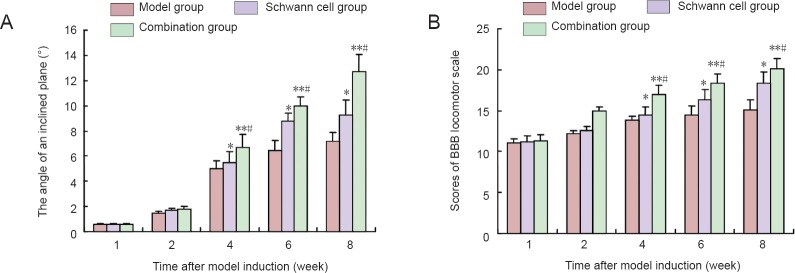
Figure 2.

Evaluation results of motor function in rats from inclined plane test (A) and modified Basso, Beattie and Bresnahan (BBB) locomotor scale (B).
Data are expressed as the mean ± SD, with 10 rats in each group at each time point. Data were analyzed with repeated measures analysis of variance and Student-Newman-Keuls test. *P < 0.05, **P < 0.01, vs. model group; #P < 0.05, vs. Schwann cell group.
