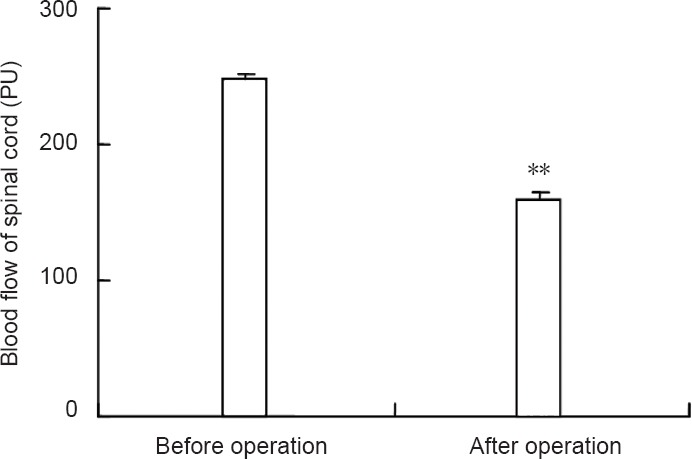
Figure 3.

Spinal cord blood flow in the intervertebral disc extrusion model.
Data are expressed as the mean ± SEM. Statistical significance between groups was evaluated using least significant difference test (when N is unequal). **P < 0.01, vs. before operation.
