Figure 4.

Cerebral tumor xenograft determined by MRI scans.
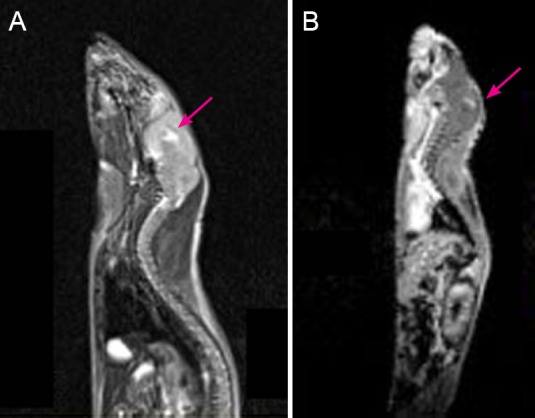
(A, B) Cerebral tumor xenograft (arrows) on T2- and T1-weighted contrast images.

Cerebral tumor xenograft determined by MRI scans.
(A, B) Cerebral tumor xenograft (arrows) on T2- and T1-weighted contrast images.