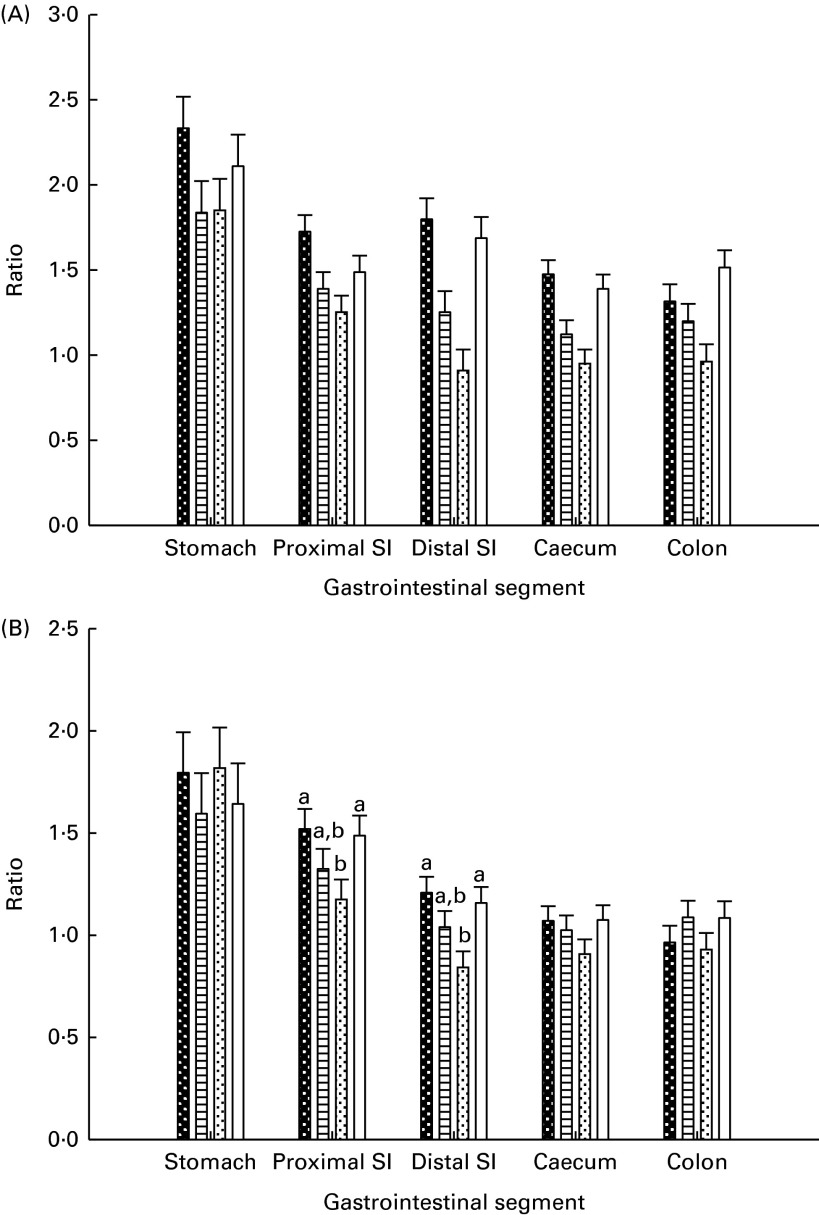
Fig. 2.
Lactic acid bacteria:haemolytic E. coli ratio (A) and lactic acid bacteria:total coliform bacteria ratio (B) in the gastrointestinal digesta of piglets. Values are least-squares means, with their standard errors represented by vertical bars. a,bMean values with unlike letters were significantly different (P≤ 0·05). Four piglets were analysed per treatment and gastrointestinal segment. Base ( ), piglets killed at the beginning of the experiment; BC-fed (
 ), piglets separated from the sow and fed bovine colostrum; MR-fed (
 ), piglets separated from the sow and fed a commercial milk replacer; Sow-Milk (
 ), piglets kept with the sow. SI, small intestine. (A) P
treat= 0·068; P
seg< 0·001; P
treat × seg= 0·055. (B) P
treat= 0·302; P
seg< 0·001; P
treat × seg= 0·033.

