
Fig 2.
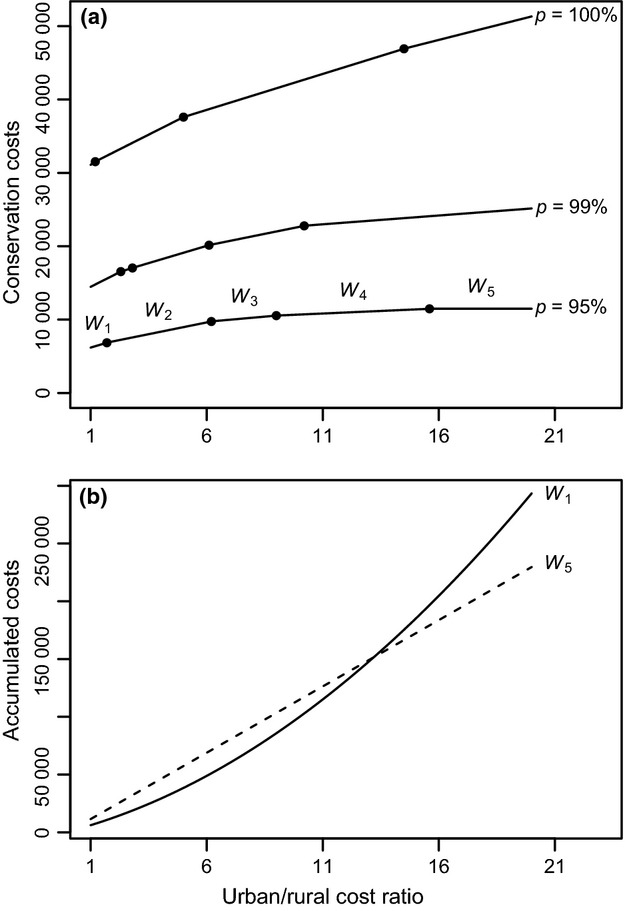
(a) Minimal costs to conserve p = 95%, 99% and 100% of split diversity with varying urban/rural cost ratios. The points on the curves indicate the change in the optimal sets of QDS found by ILP. For p = 95%, we identified five optimal sets denoted by W1 to W5. Also note that preserving the last 1% of diversity more than doubles the conservation cost. (b) Accumulated costs for optimal sets of QDS W1 and W5 as the cost ratios gradually increase over time.