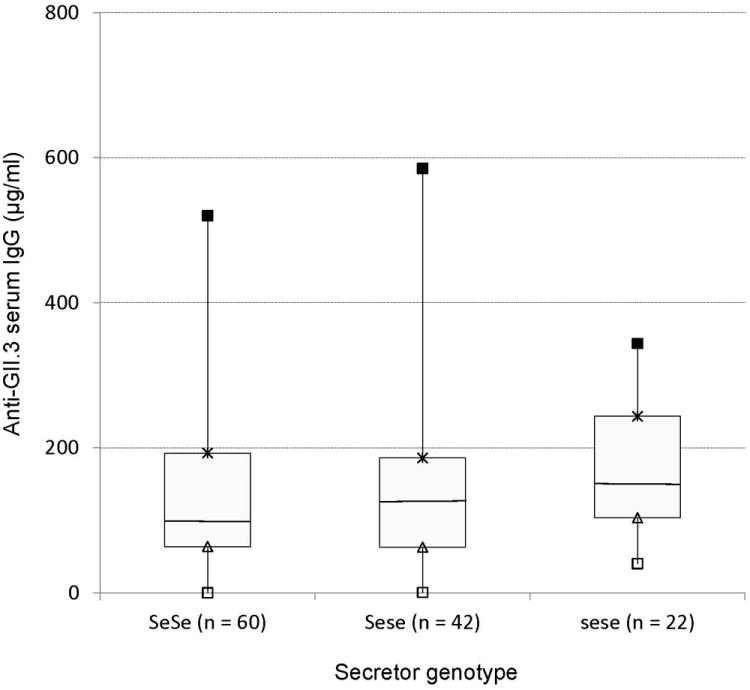
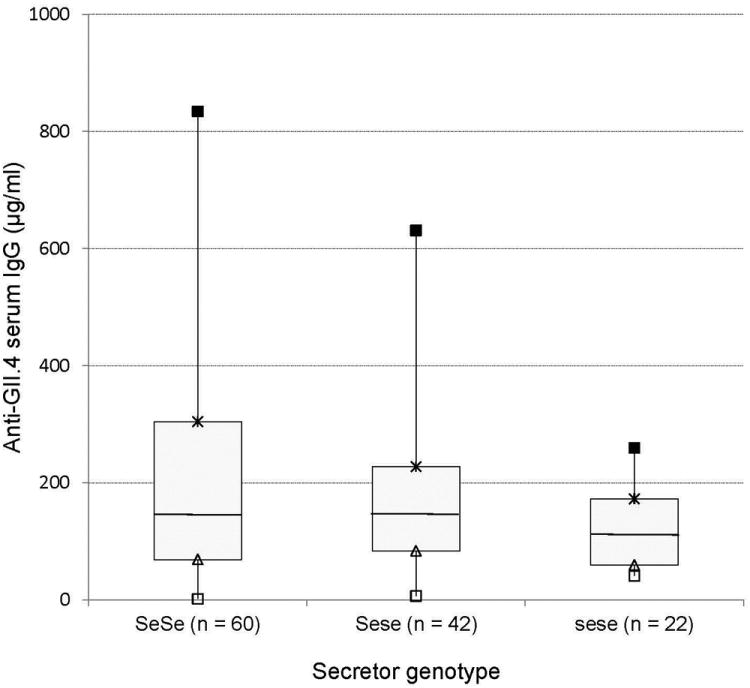
Figure 2.


GII.3 and GII.4 specific serum IgG levels (μg/ml) in children with homozygous secretor, heterozygous secretor and weak secretor. Box plots interpreted as follows: ■=maximal IgG; × = 75th percentile; the horizontal lines in the boxes represent the medians; ▲ = 25th percentile; □ = minimal IgG.
