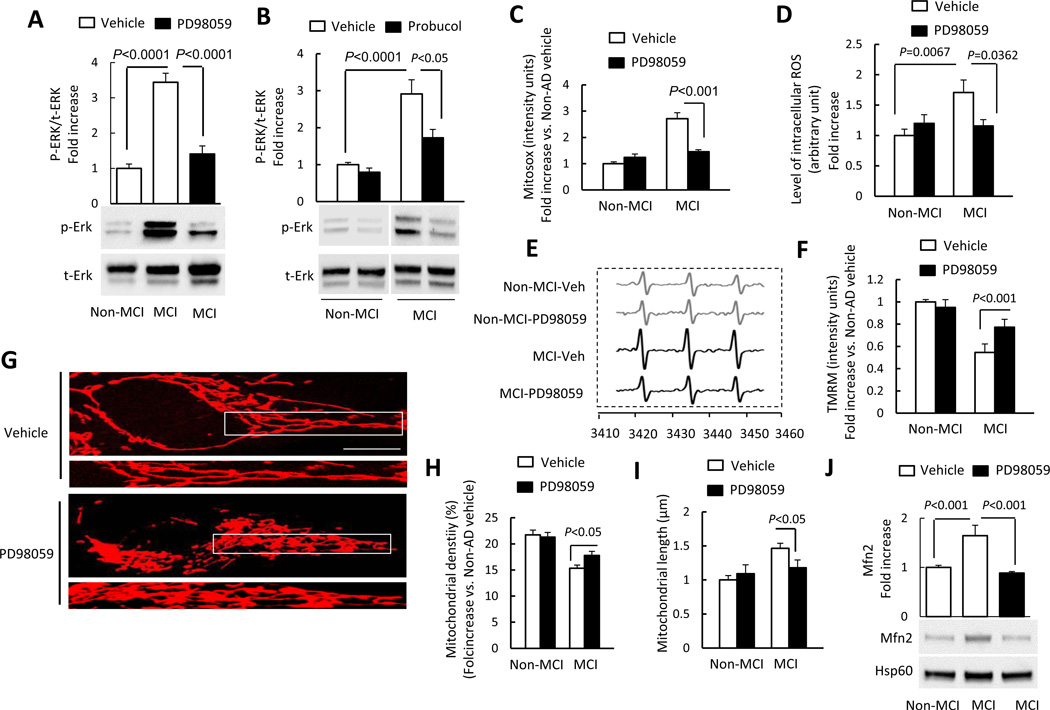
Figure 5.
Inhibition of ERK activation rescued abnormal mitochondrial function and morphology. (A–B) Densitometry of immunoreactive bands for phospho-ERK1/2 (p-ERK1/2) using NIH Image J software, normalized to total-ERK1/2 (t-ERK1/2) in indicated cell groups treated with PD98059 (10 µM for 2 h) (A), probucol (10 µM for 24 h) (B), or vehicle. Representative immunoblots are shown in lower panel. (C) PD98059 treatment decreased Mitosox staining intensity in MCI cybrid cells compared to vehicle treatment. (D–E) PD98059 treatment decreased intracellular ROS production in MCI cybrids compared to vehicle treatment measured by EPR. Quantification of EPR values in the indicated cybrid cells (D). (E) Representative EPR spectra. (F) TMRM staining intensity was significantly increased in MCI cybrid cells treated with PD98059. (G–I) Effects of ERK inhibitor on mitochondrial morphology. Representative images are shown for Mitotracker Red staining. The lower panel is a larger image corresponding to the indicated image above (Scale bar = 5 µm) (G). Mitochondrial density (H) and average length (I) were measured in the indicated cell groups treated with PD98059 or vehicle. (J) Quantification of immunoreactive bands for Mfn2 normalized to Hsp60 in mitochondrial fractions of the indicated cell group with PD98059 or vehicle treatment. Representative immunoblots are shown in lower panel. Data are expressed as fold increase relative to vehicle-treated Non-MCI cybrid cells. N = 5–7 cell lines/group.

