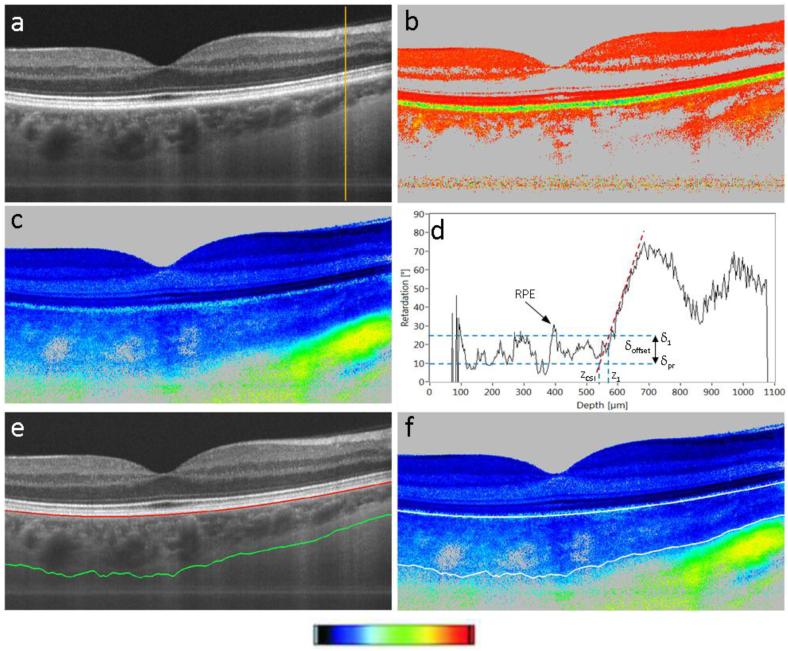
Fig. 1.
PS-OCT images of human fovea region to illustrate segmentation of choroid. a) Intensity B-scan; b) DOPU B-scan (color bar: 0-1); c) retardation B-scan (color bar: 0° - 90°); d) retardation A-scan (position shown by orange line in a)); e) intensity B-scan with segmentation lines (red: RPE, green: CSI); f) retardation B-scan with segmentation lines (top white line: RPE, bottom white line: CSI, color bar: 0° - 90°). B-scan dimensions: 19° (horizontal) × 1 mm (vertical; geometric distance).

