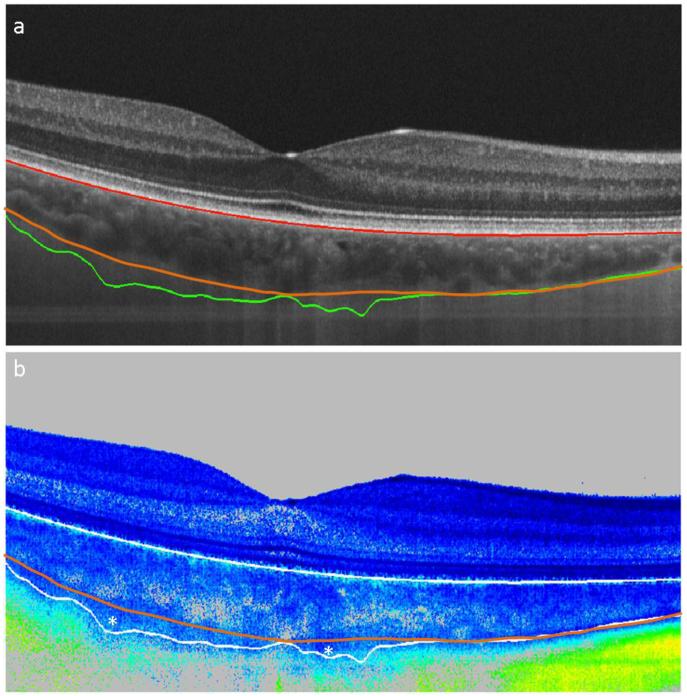
Fig. 5.
PS-OCT B-scans of a human retina to illustrate deviations between PS-OCT based choroidal segmentation and results derived manually from intensity image. See text for details. a) Intensity (red line: RPE, green line: CSI by PS-OCT, orange line: CSI by manual segmentation); b) retardation (top white line: RPE, bottom white line: CSI by PS-OCT, orange line: CSI by manual segmentation; color bar: cf. Fig. 1). B-scan dimensions: 19° (horizontal) × 1060 μm (vertical; geometric distance).

