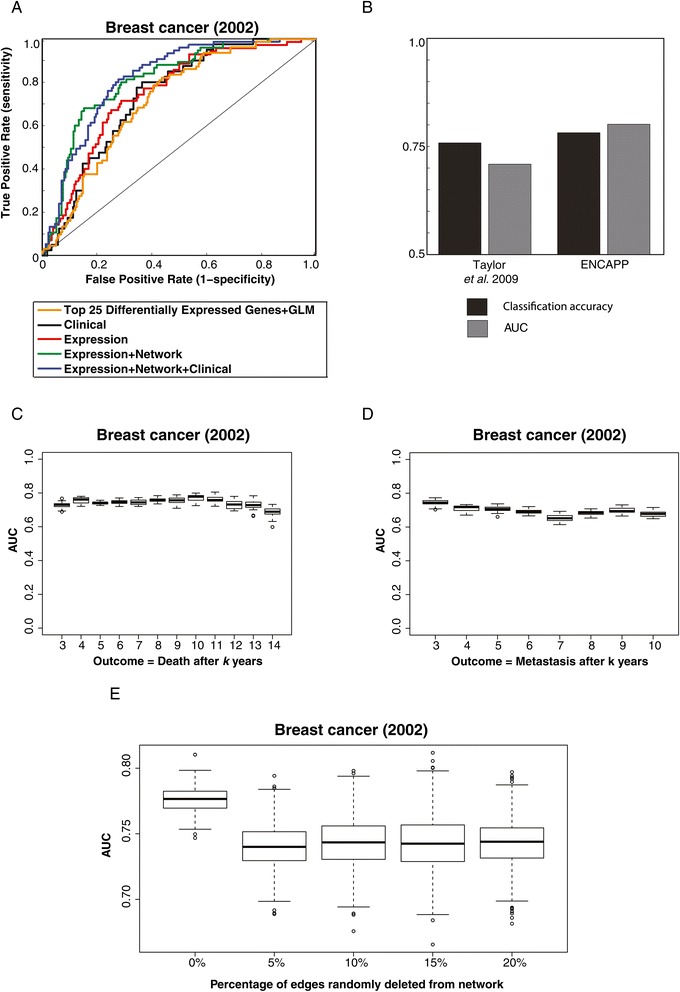
Figure 4.

Predicting breast cancer prognosis using differentially expressed functional modules. (A) ROC curves for prognosis prediction of patients in the breast cancer (2002) dataset using clinical data alone, expression data alone, expression data with the protein network and all 3 datasets together. (B) Comparison of the performance of ENCAPP with Taylor et (values shown are those obtained in the absence of clinical information). (C) Boxplots showing performance of ENCAPP at different right censoring cutoffs k used for determining prognostic outcome: for each boxplot, good prognosis is defined as survival for > =k years and bad as death within k years. (D) Boxplots showing performance of ENCAPP at different right censoring cutoffs k used for determining prognostic outcome; here a different outcome definition is used: for each boxplot, good prognosis is defined as no metastasis for > =k years and bad as metastasis within k years. (E) Boxplots showing performance of ENCAPP using random networks that have 5%, 10%, 15% and 20% of the total edges in the original network randomly removed.
