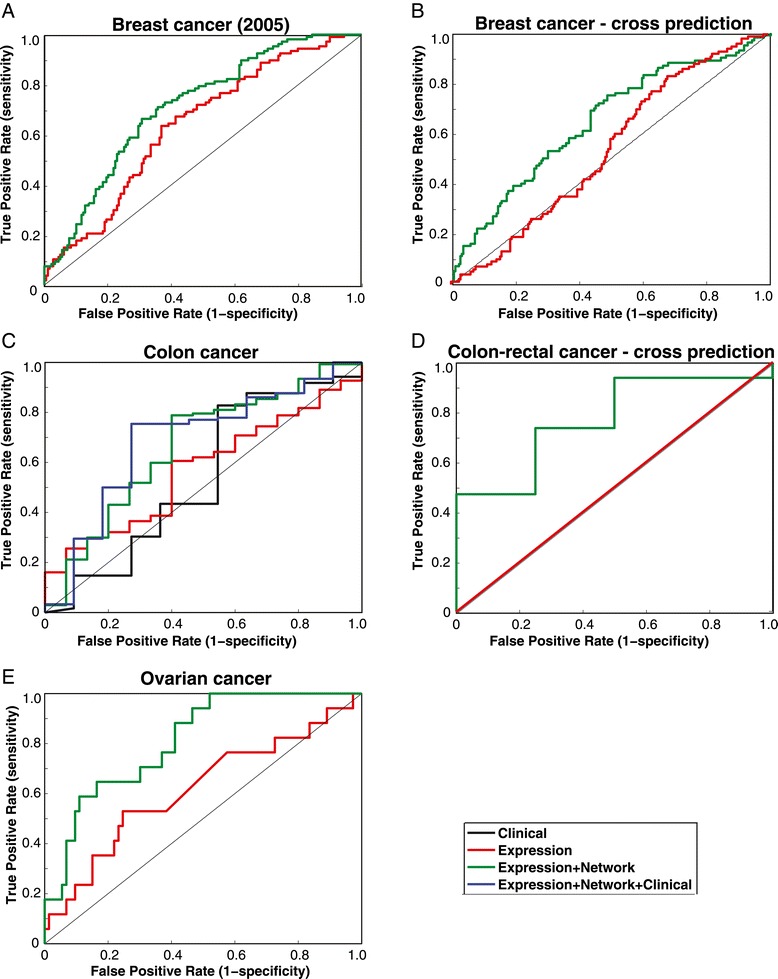
Figure 5.

Prognosis prediction for different cancer types and subtypes. (A) ROC curves for prognosis prediction of patients in the breast cancer (2005) dataset using expression data alone and expression data with the protein network. (B) ROC curves for prognosis prediction of patients in the breast cancer (2002) dataset using data from the breast cancer (2005) dataset. (C) ROC curves for prognosis prediction of patients in the colon cancer dataset using clinical data alone, expression data alone, expression data with the protein network and all 3 datasets together. (D) ROC curves for prognosis prediction of patients in the rectal cancer dataset using data from the colon cancer dataset. (E) ROC curves for prognosis prediction of patients in the ovarian cancer dataset using expression data alone and expression data with the protein network.
