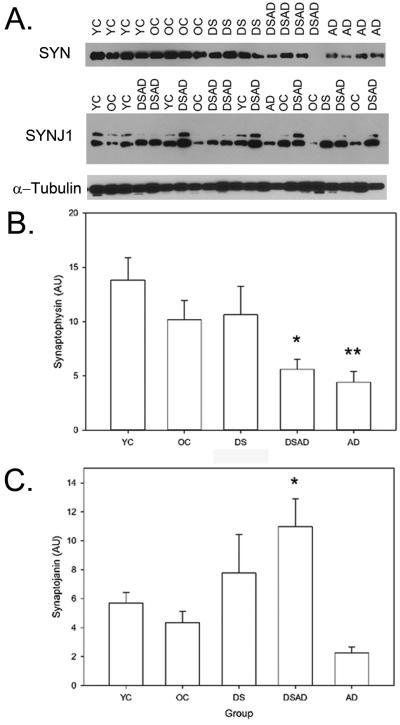
Figure 1.
SYN and SYNJ1 in DS. Representative western blots with SYN and SYNJ1 in YC, OC, DS, DSAD, and AD cases showing a ~38kDa and ~150 kDa bands, respectively. α-tubulin was used as a loading control and did not show systematic differences predicting SYNJ1 or SYN protein levels (A). SYN was significantly lower in DSAD and sporadic AD cases relative to control or DS cases alone. DSAD was not different from sporadic AD in SYN level. *p<.05 DSAD < DS, YC, OC, **p<.05 AD < DS, YC, OC. (B). SYNJ1 was significantly higher in DS overall and further increased in DSAD. DSAD cases had significantly higher levels of SYNJ1 than sporadic AD cases. *p<.05 DSAD>AD, OC. Bars represent group means and error bars are standard error of the mean.

