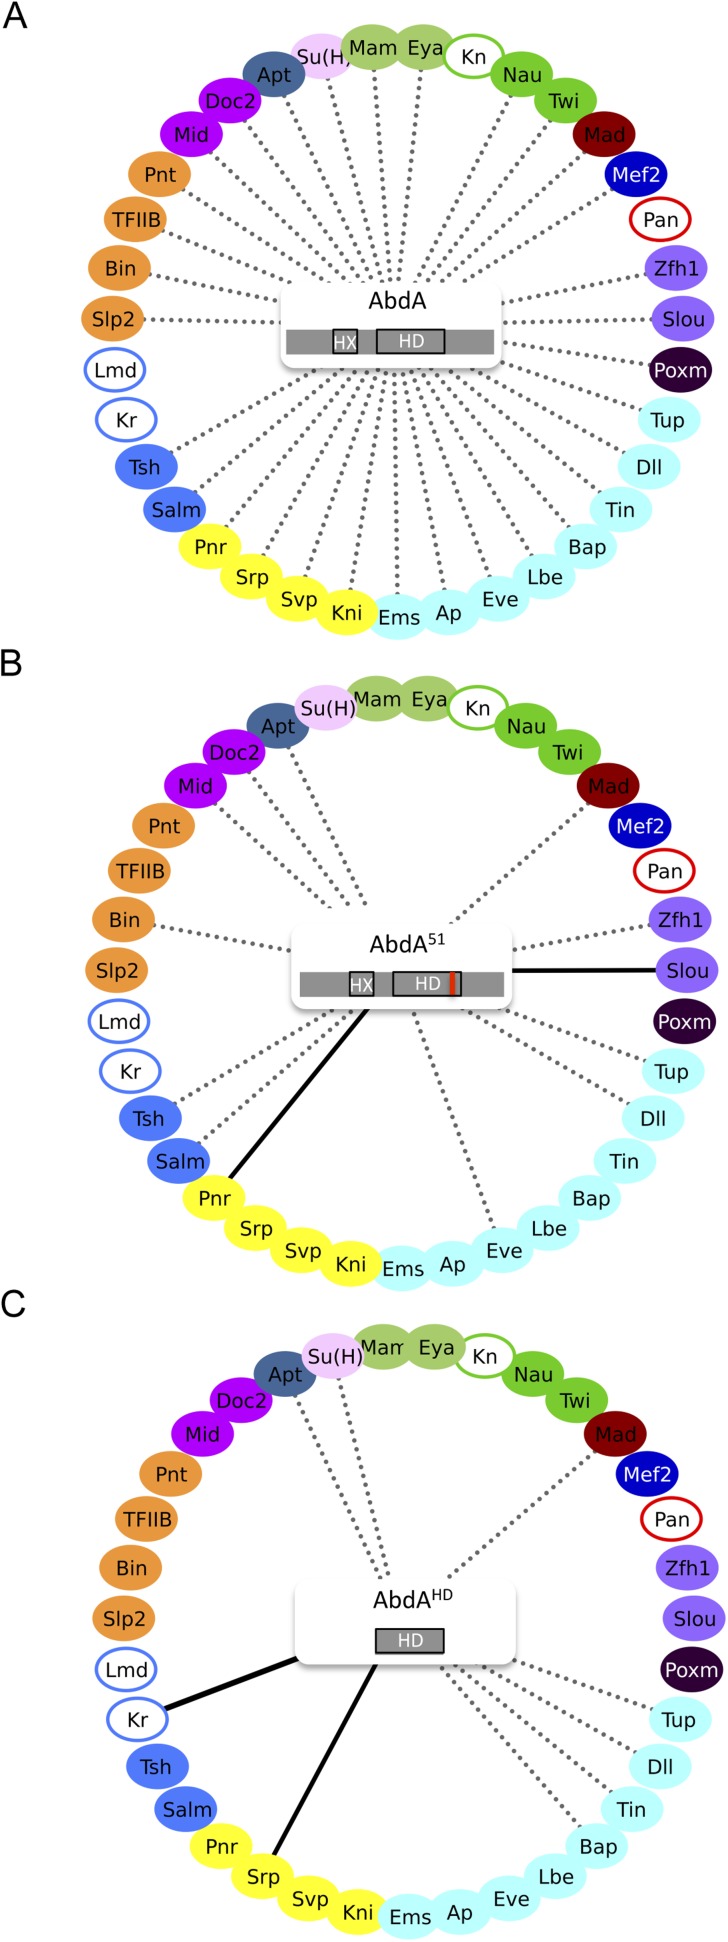
Figure 3. Role of the homeodomain (HD) in the AbdA interactome.
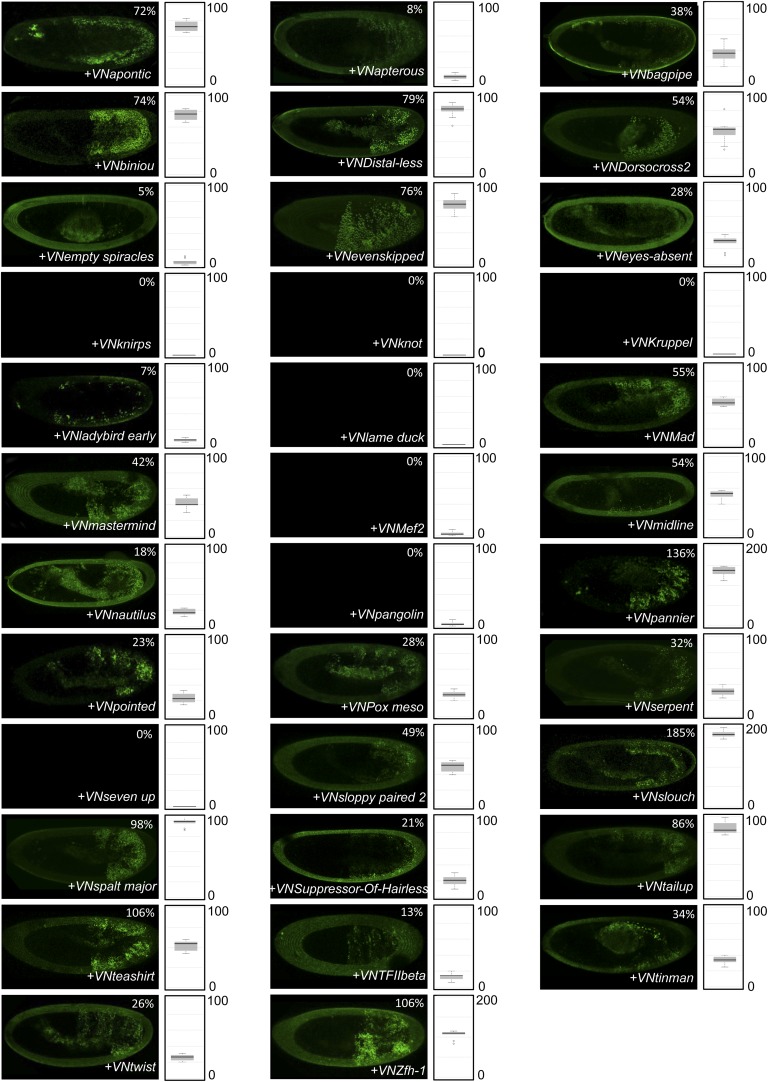
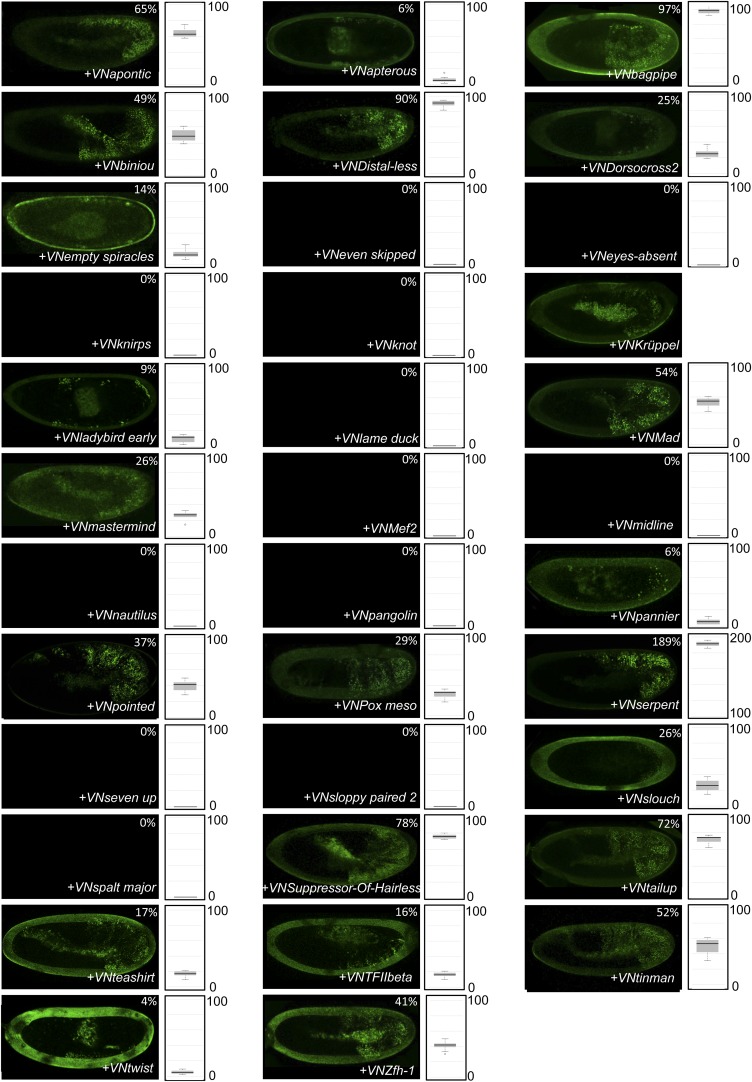
(A) Interactome with wild type AbdA. (B) Interactome with the DNA-binding deficient form of AbdA (mutated in the residue 51 of the HD, as illustrated with the red bar). See also Figure 3—figure supplement 1. (C) Interactome with the HD of AbdA. See also Figure 3—figure supplement 2. Each interactome is represented with the 35 TFs. The colour code for TFs corresponds to their type of DNA-binding domain, as shown in the Figure 2B. TFs that are not colour-filled correspond to TFs that do not interact with the wild type Hox protein. Those TFs are not connected to the Hox protein. Dotted lines indicate TFs that do interact with the wild type Hox protein. Interactions with Hox variants are depicted as the following: dotted lines indicate unaffected interactions (in between 51% and 119% of the wild type interaction); solid black lines indicate stronger (equal or superior to 120% of the wild type interaction) or novel interactions (with a non-colour-filled TF); absence of the dotted line with a colour-filled TF indicates a partial (equal or below to 50% of the wild type interaction) or complete loss of the interaction. Each Hox variant is schematized in the centre of the interactome. HD: Homeodomain. HX: Hexapeptide. See also ‘Materials and methods’.


