. 2015 Apr 14;4:e06034. doi: 10.7554/eLife.06034

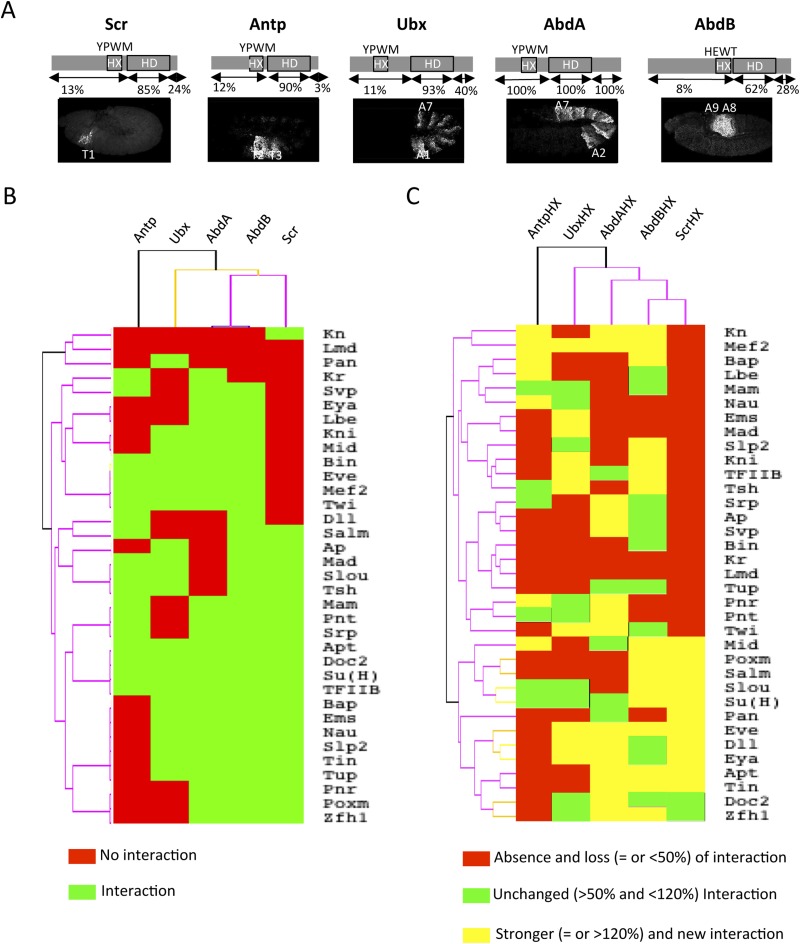
Figure 4. Comparison between wild type and Hexapeptide(HX)-mutated Hox interactomes.

(A) Embryonic expression profile (grey) and protein sequence identity of each of the five Drosophila Hox proteins under study. The percentage of sequence identity is given in comparison to AbdA. The conserved core sequence of the HX is also given for each Hox protein. (B) Heatmap showing the organisation of wild type Hox interactomes with the 35 TFs. See also Figure 4—figure supplements 1–4. (C) Heatmap showing the organisation of HX-mutated Hox interactomes with the 35 TFs. See also Figure 4—figure supplements 5–9. Interactions are symbolized by a colour code, as indicated. Note that the yellow colour, which corresponds to a gain of the interaction potential, appears with the HX mutation in all Hox proteins. Dendogram branches are coloured according to their bootstrap score: black 100%, grey 90–100%, blue 80–90%, green 70–80%, yellow 60–70%, orange 50–60%, pink 0.1–50%, red 0% support respectively.

DOI: http://dx.doi.org/10.7554/eLife.06034.012

Figure 4.

Figure 4—figure supplement 1. BiFC between the 35 TFs and Sex combs reduced (Scr).

Figure 4—figure supplement 1.

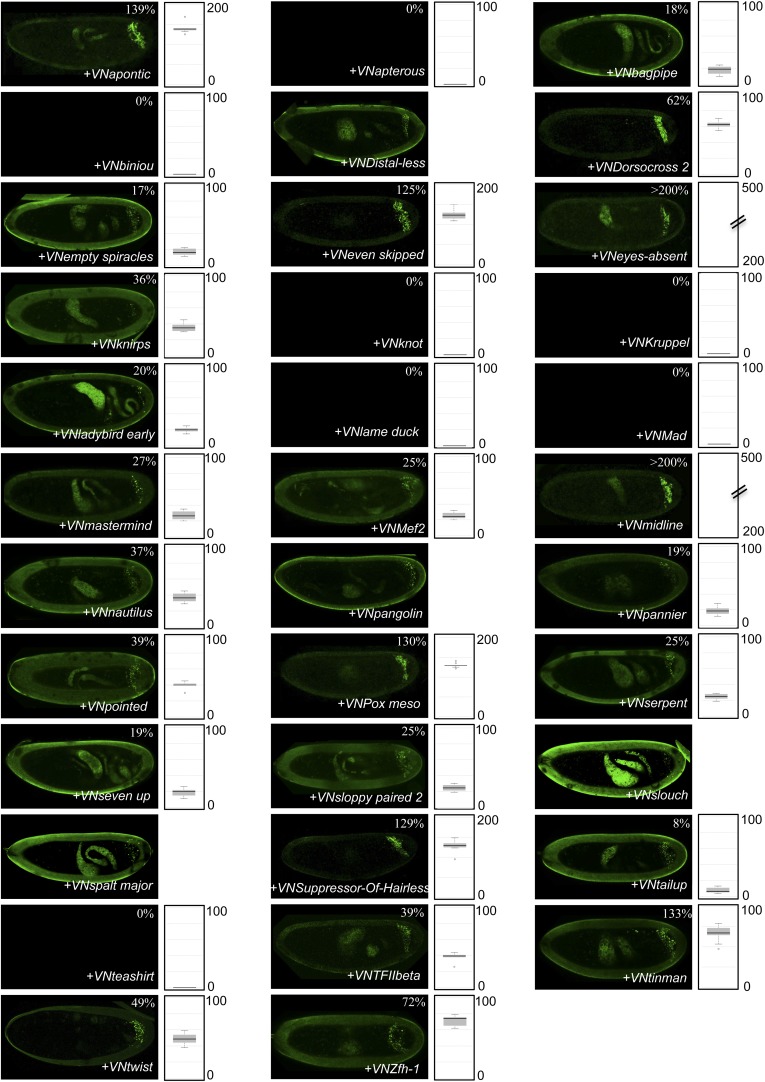
Illustrative pictures of stage 10–12 embryos are provided for each TF as indicated.
Figure 4—figure supplement 2. BiFC between the 35 TFs and Antennapedia (Antp).

Figure 4—figure supplement 2.

Illustrative pictures of stage 10–12 embryos are provided for each TF as indicated.
Figure 4—figure supplement 3. BiFC between the 35 TFs and Ultrabithorax (Ubx).

Figure 4—figure supplement 3.

Illustrative pictures of stage 10–12 embryos are provided for each TF as indicated.
Figure 4—figure supplement 4. BiFC between the 35 TFs and AbdominalB (AbdB).

Figure 4—figure supplement 4.

Illustrative pictures of stage 10–12 embryos are provided for each TF as indicated.
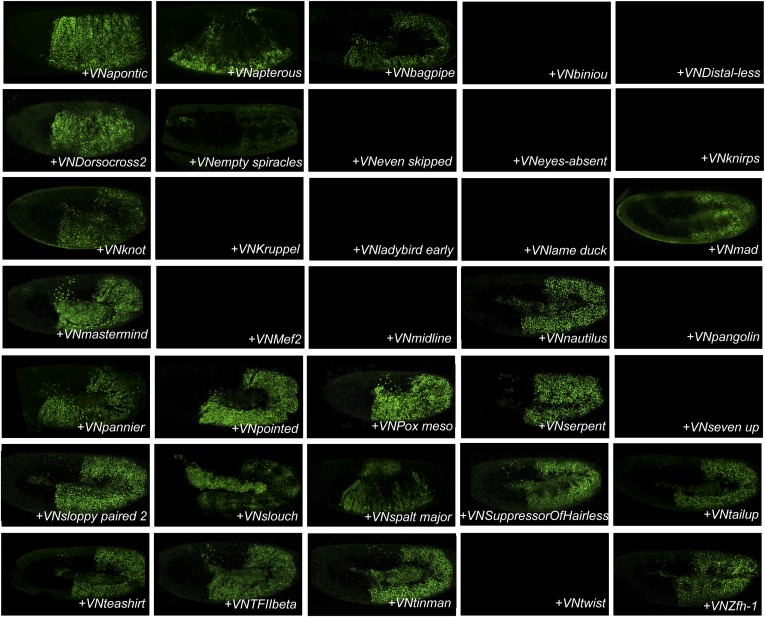
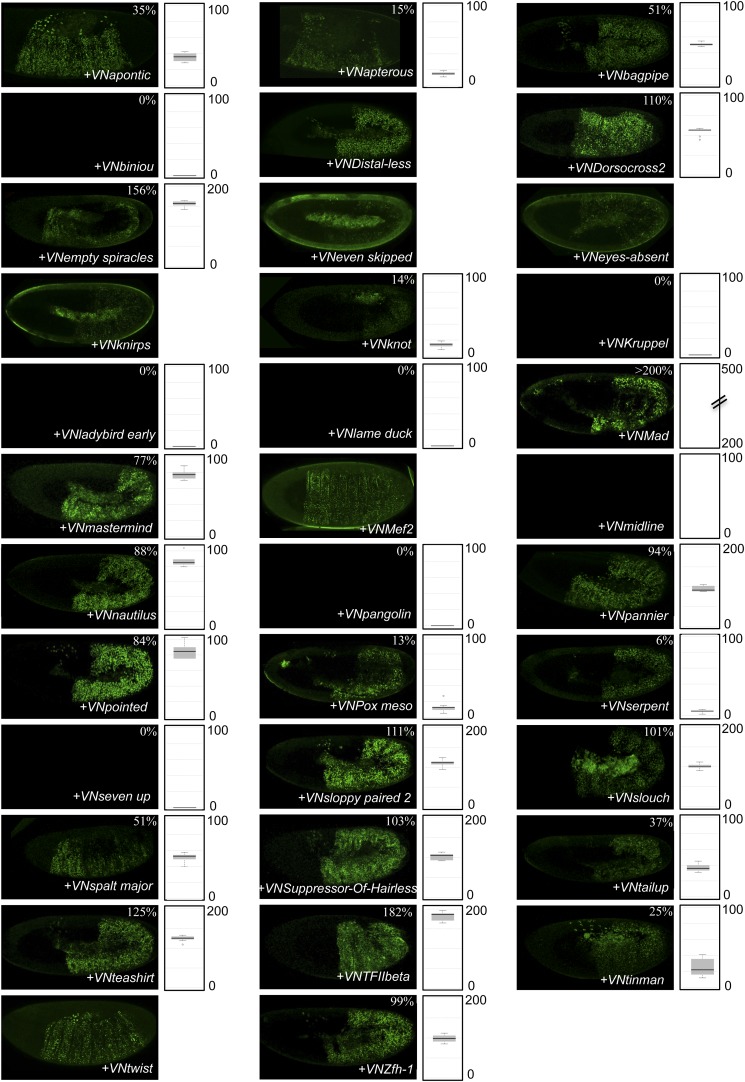
Figure 4—figure supplement 5. BiFC between the 35 TFs and hexapeptide (HX)-mutated Scr.

Figure 4—figure supplement 5.

Illustrative pictures of stage 10–12 embryos are provided for each TF as indicated. Quantification was performed as in Figure 3—figure supplement 1. Illustrative pictures of slightly older embryos are shown when signals were strongly affected. No picture was taken in absence of BiFC. No statistical quantification is provided in the case of a new interaction (as seen for Distal-less, Even skipped, Eyes-absent, Knirps, Mef2 and Twist).
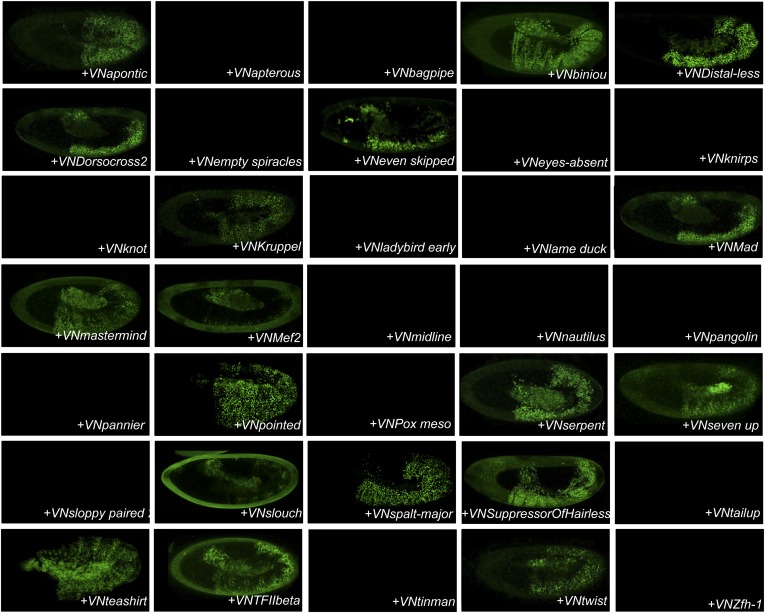
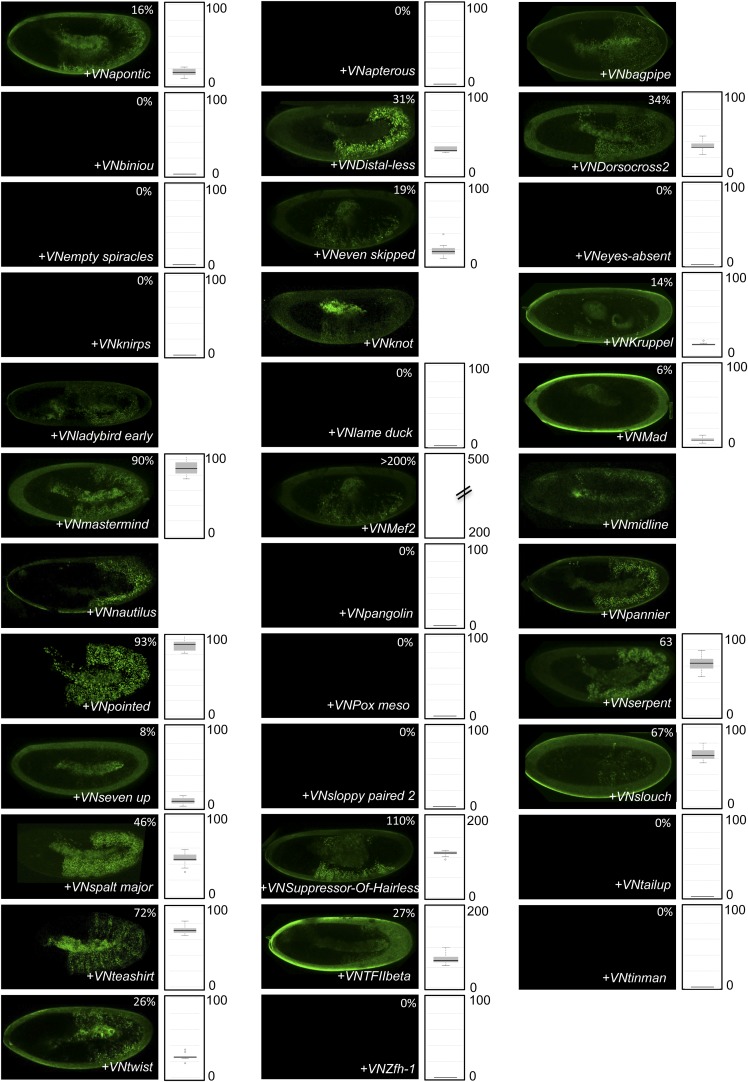
Figure 4—figure supplement 6. BiFC between the 35 TFs and hexapeptide (HX)-mutated Antp.

Figure 4—figure supplement 6.

Illustrative pictures of stage 10–12 embryos are provided for each TF as indicated. Quantification was performed as in Figure 3—figure supplement 1. Illustrative pictures of slightly older embryos are shown when signals were strongly affected. No picture was taken in absence of BiFC. No statistical quantification is provided in the case of a new interaction (as seen for Bagpipe, Knot, Ladybird early, Midline, Nautilus and Pannier).
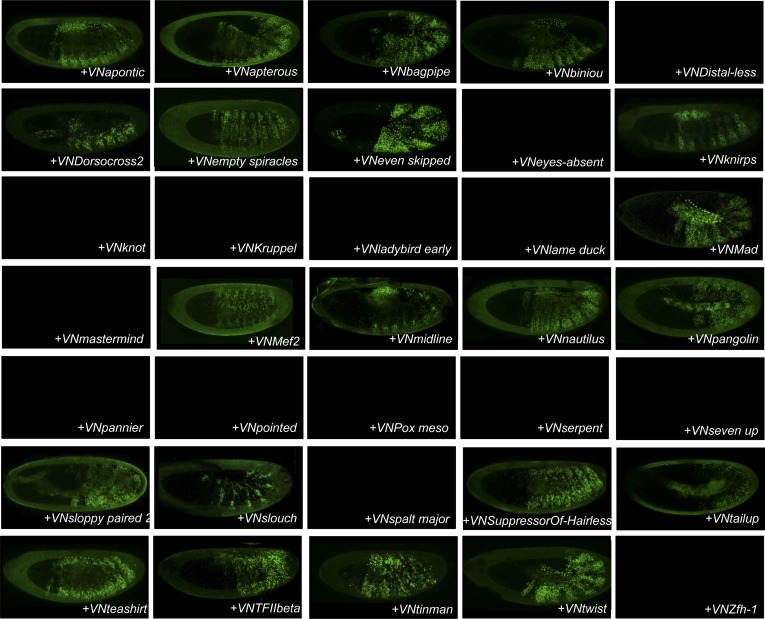
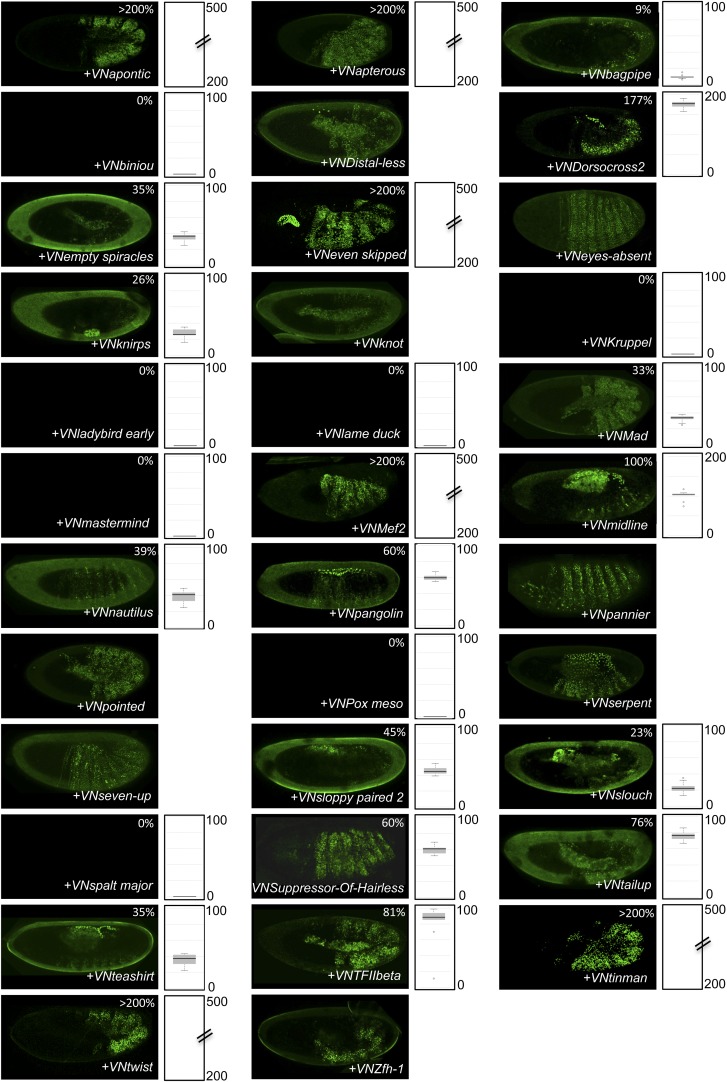
Figure 4—figure supplement 7. BiFC between the 35 TFs and hexapeptide (HX)-mutated Ubx.

Figure 4—figure supplement 7.

Illustrative pictures of stage 10–12 embryos are provided for each TF as indicated. Quantification was performed as in Figure 3—figure supplement 1. Illustrative pictures of slightly older embryos are shown when signals were strongly affected. No picture was taken in absence of BiFC. No statistical quantification is provided in the case of a new interaction (as seen for Distal-less, Eyes-absent, Knot, Pannier, Pointed, Serpent, Seven-up and Zfh-1).
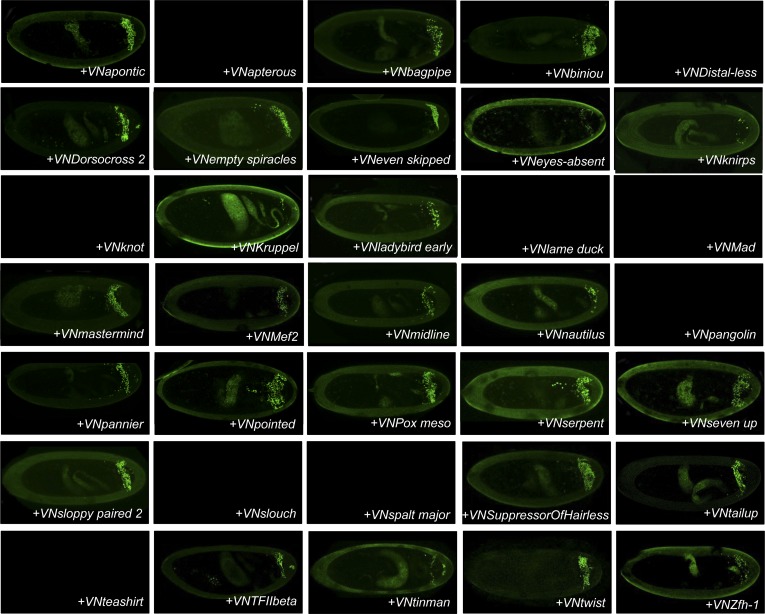
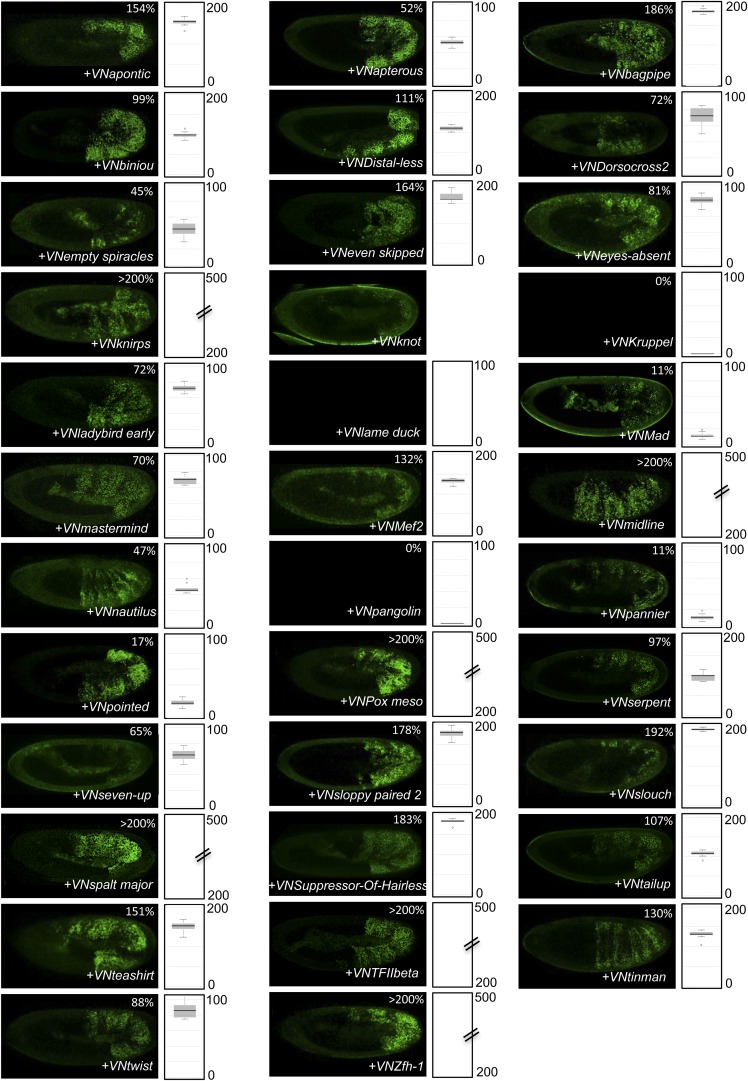
Figure 4—figure supplement 8. BiFC between the 35 TFs and hexapeptide (HX)-mutated AbdA.

Figure 4—figure supplement 8.

Illustrative pictures of stage 10–12 embryos are provided for each TF as indicated. Quantification was performed as in Figure 3—figure supplement 1. Illustrative pictures of slightly older embryos are shown when signals were strongly affected. No picture was taken in absence of BiFC. No statistical quantification is provided in the case of a new interaction (as seen for Knot).
Figure 4—figure supplement 9. BiFC between the 35 TFs and hexapeptide (HX)-mutated AbdB.

Figure 4—figure supplement 9.

Illustrative pictures of stage 10–12 embryos are provided for each TF as indicated. Quantification was performed as in Figure 3—figure supplement 1. Illustrative pictures of slightly older embryos are shown when signals were strongly affected. No picture was taken in absence of BiFC. No statistical quantification is provided in the case of a new interaction (as seen for Distal-less, Pangolin, Slouch and Spalt major).