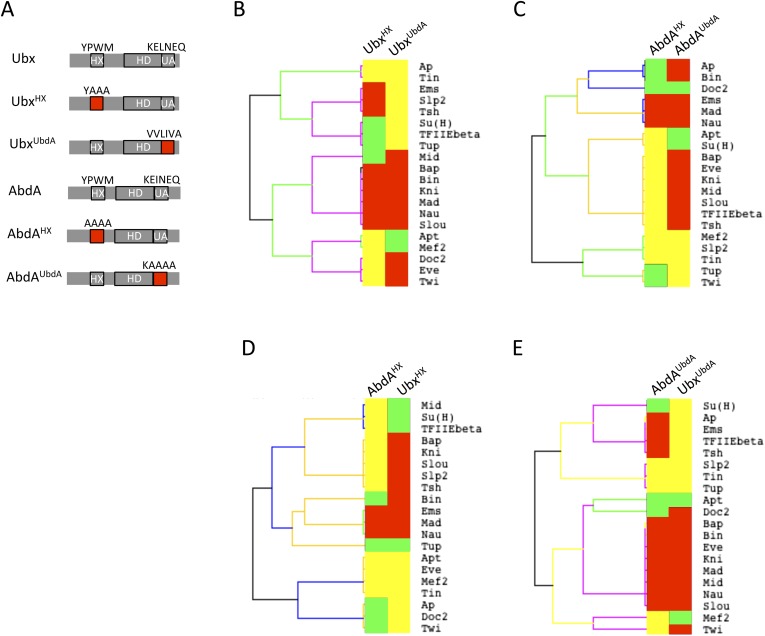
Figure 6. Usage mode of the HX and UbdA motifs in Ubx and AbdA proteins.
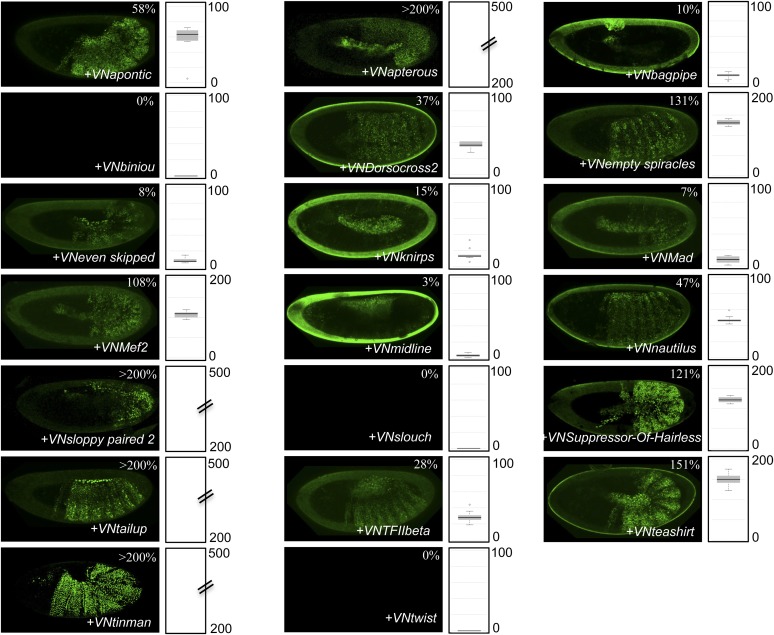
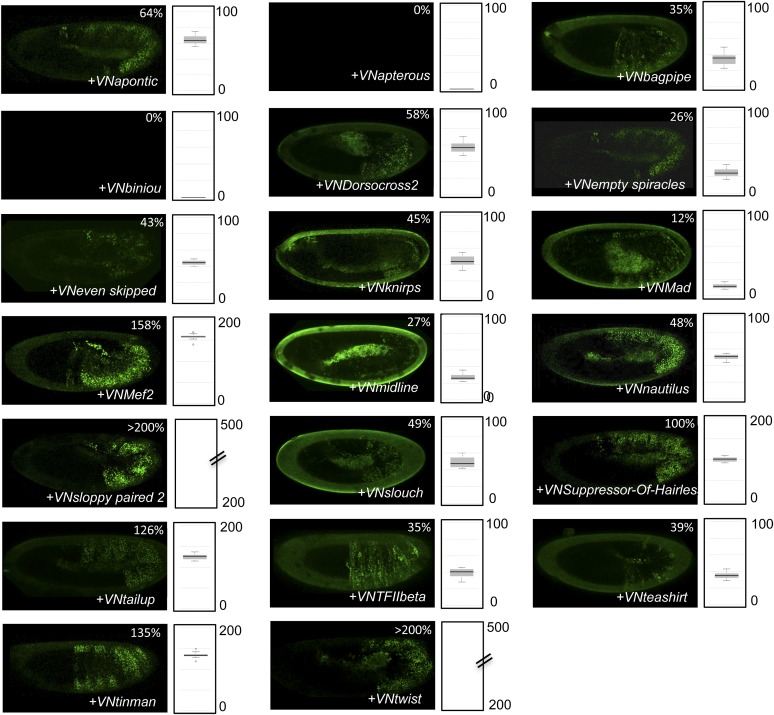
(A) Schematic representation of wild type and HX- or UbdA-mutated Ubx and AbdA proteins. (B) Heatmap comparing interaction properties of HX- and UbdA-mutated Ubx proteins with a set of 20 TFs. These TFs are common to Ubx and AbdA for BiFC. See also Figure 6—figure supplement 1. (C) Heatmap comparing interaction properties of HX- and UbdA-mutated AbdA proteins with the same set of TFs. See also Figure 6—figure supplement 2. Note that the HX and UbdA mutations have distinct or opposite effects for most of the interactions in Ubx and AbdA. (D) Heatmap comparing interaction properties of HX-mutated Ubx and AbdA proteins with the 20 common TFs. (E) Heatmap comparing interaction properties of UbdA-mutated Ubx and AbdA proteins with the 20 common TFs. Note that a higher proportion of TFs is similarly affected by the UbdA mutation in Ubx and AbdA when compared to the HX mutation. Colour code is as in Figure 4.


