. 2015 Apr 14;4:e06034. doi: 10.7554/eLife.06034

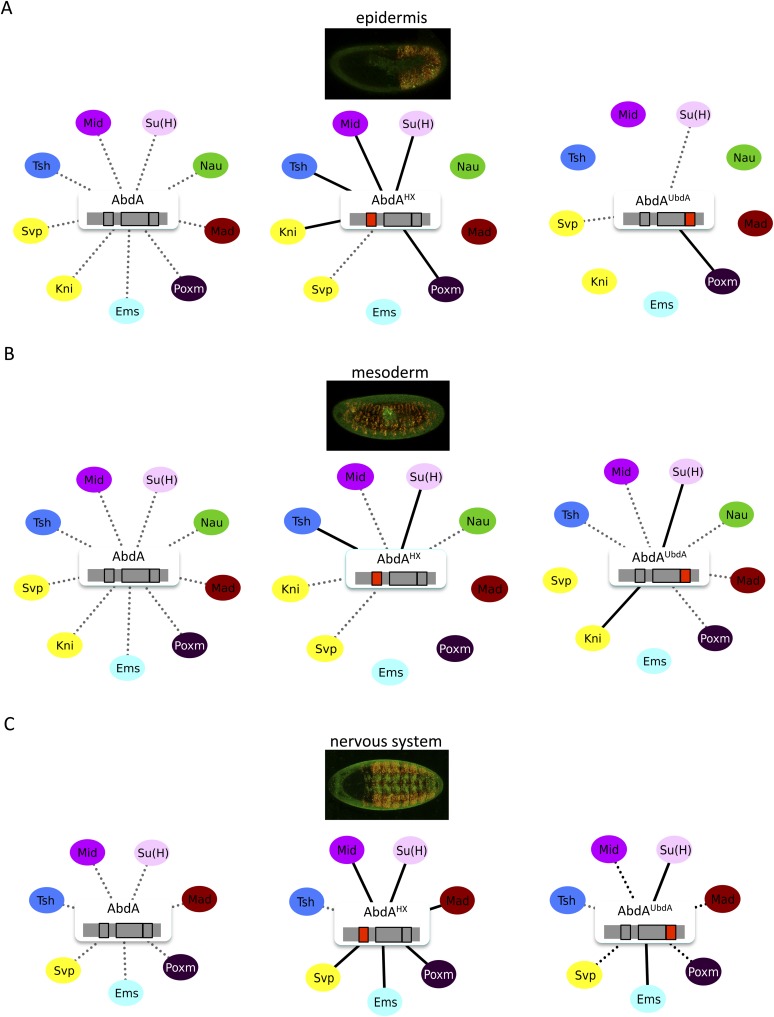
Figure 7. The HX and UbdA motifs of AbdA have different interaction properties in different embryonic tissues.

(A) Interaction properties of wild type and HX- or UbdA-mutated AbdA in the epidermis. (B) Interaction properties of wild type and HX- or UbdA-mutated AbdA in the mesoderm. See also Figure 7—figure supplement 1. (C) Interaction properties of wild type and HX- or UbdA-mutated AbdA in the nervous system. See also Figure 7—figure supplement 2. Picture of an embryo making BiFC (green) and expressing the dsRed fluorescent protein under the control of the Gal4 driver illustrates the tissue of interest in each condition. Interactomes are represented as in Figure 3.

DOI: http://dx.doi.org/10.7554/eLife.06034.027

Figure 7.

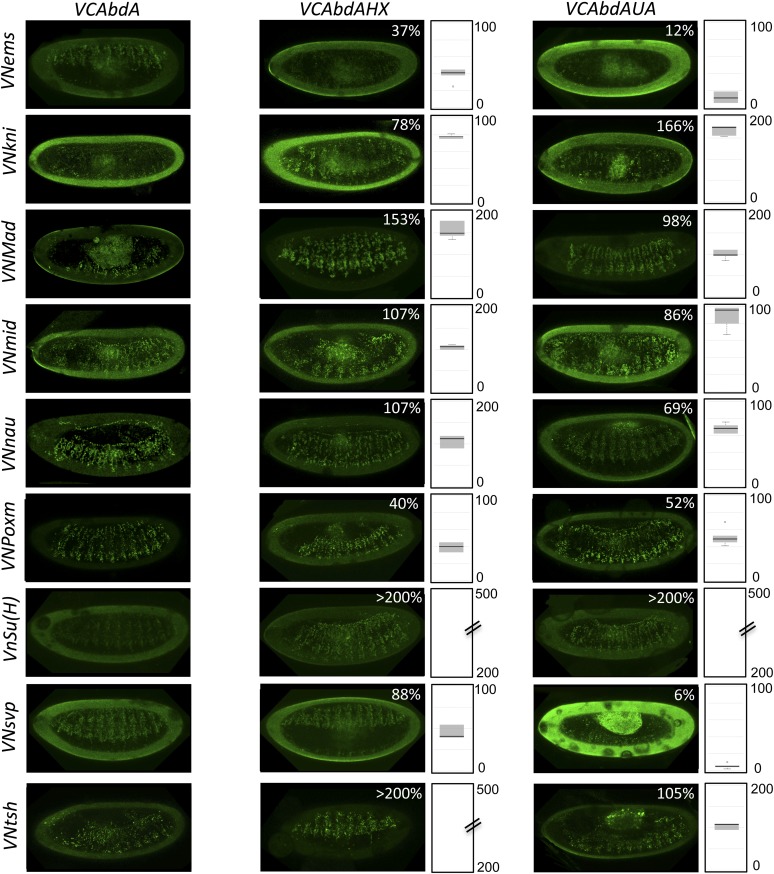
Figure 7—figure supplement 1. BiFC with wild type, HX- or UbdA-mutated AbdA in the mesoderm.

Figure 7—figure supplement 1.

BiFC was performed with a set of 9 TFs that were all BiFC-positive with AbdA in the epidermis. Statistical quantification of BiFC signals with mutated AbdA proteins is shown as a boxplot representation. Quantification was performed in the mesoderm of stage 12 embryos (see also ‘Materials and methods’).
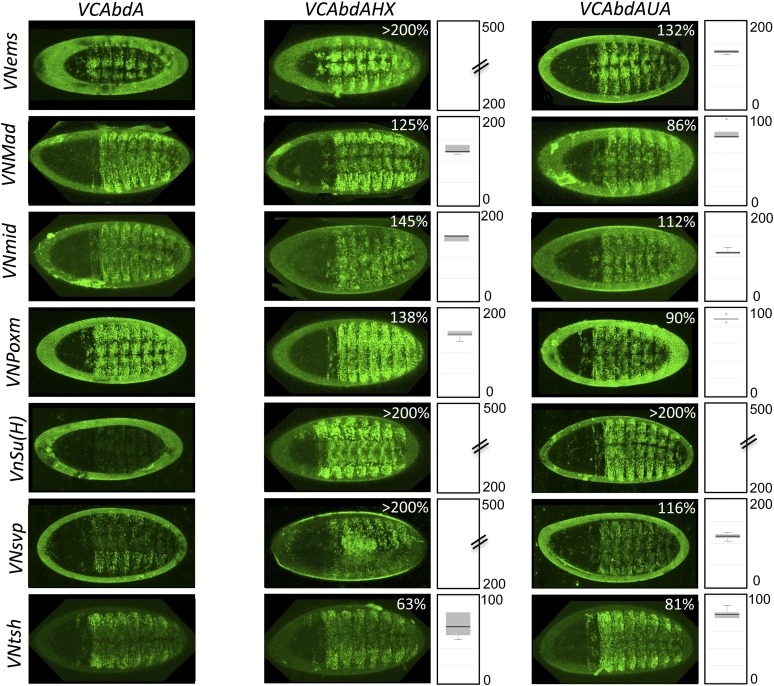
Figure 7—figure supplement 2. BiFC with wild type, HX- or UbdA-mutated AbdA in the nervous system.

Figure 7—figure supplement 2.

BiFC was performed with a set of seven TFs that were all BiFC-positive with AbdA in the epidermis. Statistical quantification of BiFC signals with mutated AbdA proteins is shown as a boxplot representation. Quantification was specifically performed in the ventral nerve cord of stage 14 of live embryos (see also ‘Materials and methods’).