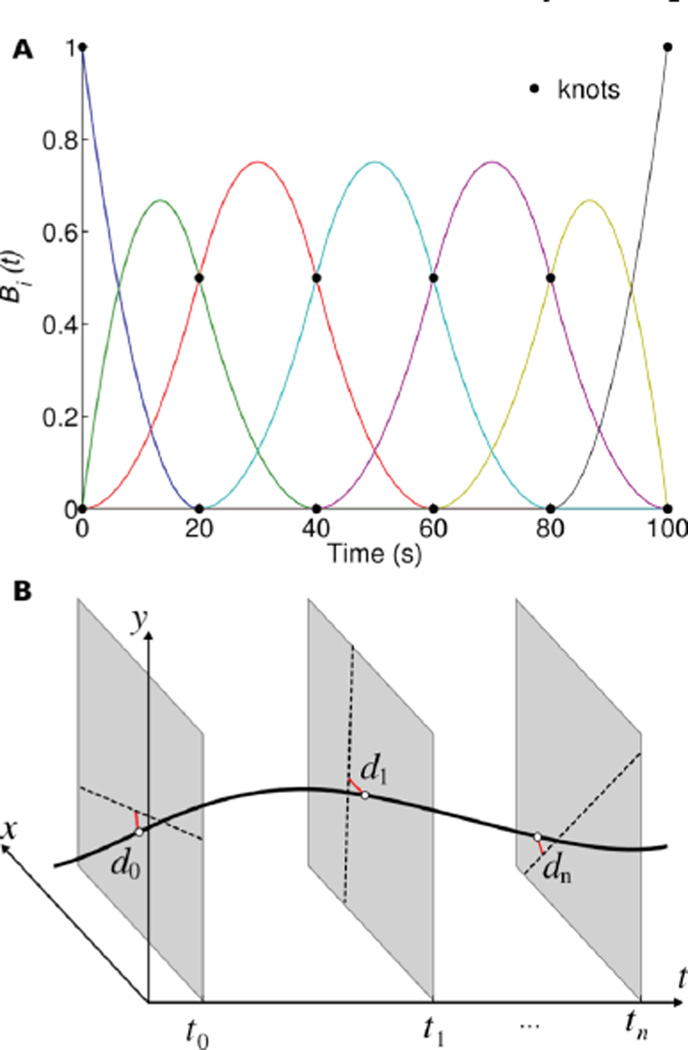
Fig. 2.
Depiction of the proposed trajectory reconstruction algorithm. (A) Example of cubic B-spline basis functions used to model the time-varying trajectory of a single moving source (N=7). (B) The optimal trajectory (black curved line) is estimated by finding the 3D spline that has minimum mean-square distance (red lines) to the recorded coincidence events (dashed lines). Tracking is performed in 3D but, for simplicity, only two spatial dimensions are shown.

