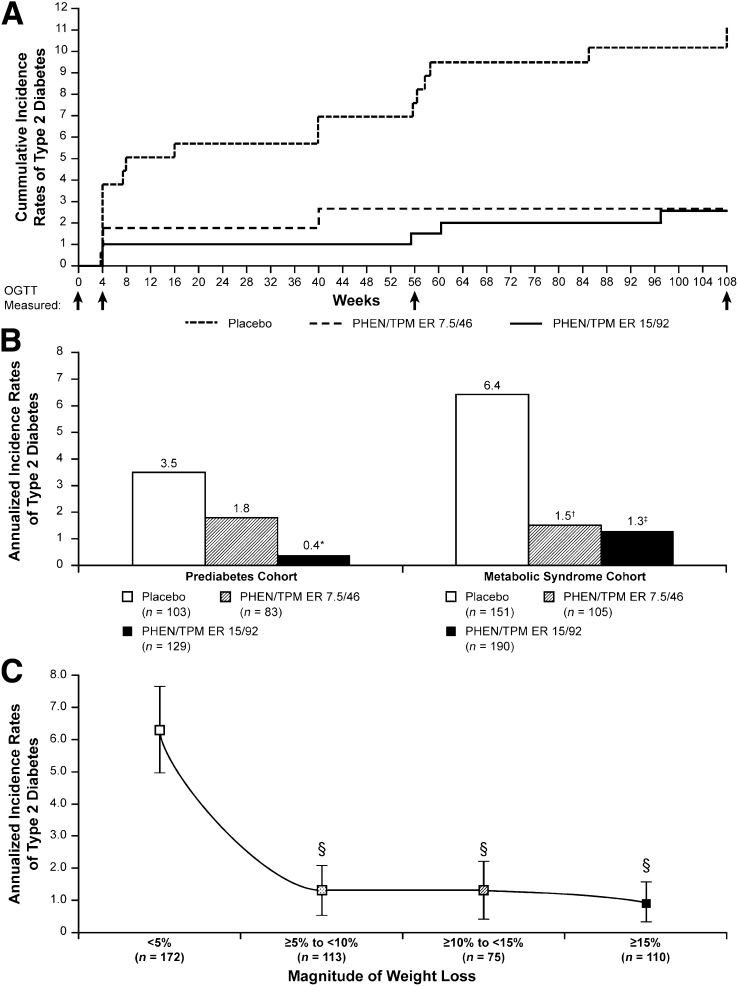
Figure 2.
Incidence rates of type 2 diabetes from baseline to week 108 in SEQUEL study. A: Cumulative incidence rates of type 2 diabetes at study end (Kaplan-Meier) in the prediabetes and/or MetS cohort (ITT). B: Annualized incidence rates of type 2 diabetes at study end in the prediabetes cohort and the MetS cohort (ITT). C: Relationship between weight loss and type 2 diabetes incidence at study end in the prediabetes and/or MetS cohort (ITT-MI). Error bars represent 95% CI. Annualized incidence rate of type 2 diabetes was based on first occurrence of two consecutive fasting glucose ≥7.0 mmol/L, two consecutive OGTT ≥11.1 mmol/L, or taking antidiabetes medications at end point. *P = 0.0125 vs. placebo; †P = 0.0093 vs. placebo; ‡P = 0.0007 vs. placebo; §P < 0.05 vs. <5% weight loss for all comparisons.

