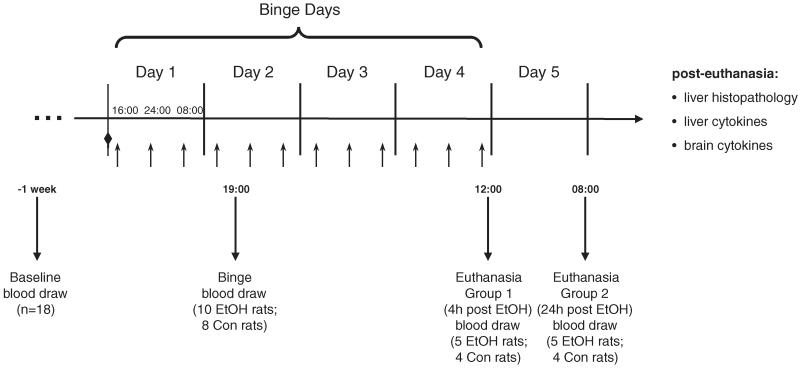
Fig. 1.
Time course of experiment: downward arrows indicate time-points at which blood was drawn for thiamine, liver enzyme, and cytokine analysis. Diamond indicates loading dose (at 14:00 on day 1). Upward arrows indicate 3 time-points per day (exact times for first day included; times consistent across 4 days) during which animals received treatment (i.e., 3 g/kg 25% EtOH or 5% dextrose).

