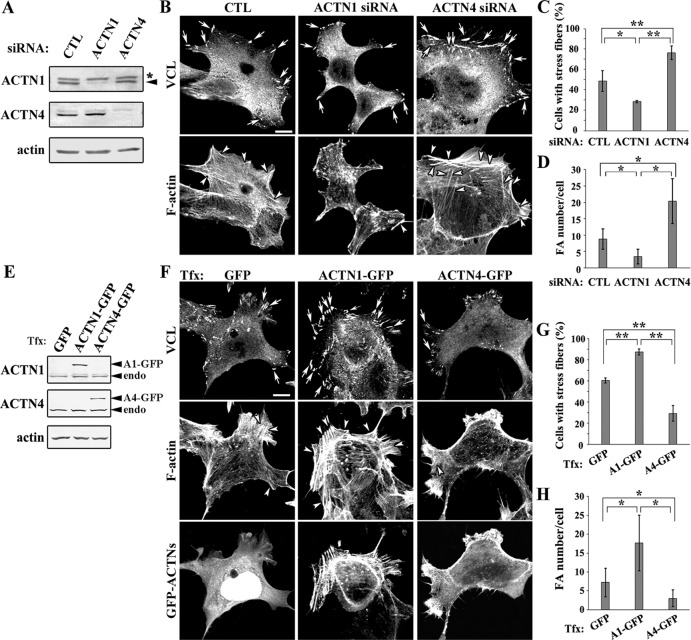
Fig 2. Effect of ACTN1 and ACTN4 on DLD-1 cell morphology.
(A) ACTN1 and ACTN4 expression was silenced by siGENOME SMARTpool siRNA in DLD-1 cells. Efficient knockdown was confirmed by western blotting using ACTN isoform-specific antibodies. The arrowhead indicates endogenous ACTN1. The asterisk indicates a non-specific crossreacting band. (B) Cells transfected with the indicated siRNAs were stained for vinculin (VCL) and F-actin and observed by confocal microscopy. The arrows and arrowheads indicate focal adhesions and stress fibers, respectively. Scale bar = 10 μm. (C) The percentages of siRNA-treated cells forming stress fibers are graphed. Data represent the mean ± SD of three independent experiments. *P < 0.05, **P < 0.01. (D) The focal adhesion numbers per cell of siRNA-treated cells were graphed. Data represent the mean ± SD of 71 cells for control, 73 cells for si-ACTN1 cells, and 55 cells for si-ACTN4 cells. *P < 0.05. (E) Transient expression of ACTN1-GFP and ACTN4-GFP in DLD-1 cells was confirmed by western blotting using ACTN isoform-specific antibodies. (F) GFP, ACTN1-GFP, and ACTN4-GFP were expressed in DLD-1 cells, which were then stained for VCL and F-actin and observed by confocal microscopy. The arrows and arrowheads indicate focal adhesions and stress fibers, respectively. Scale bar = 10 μm. (G) The percentages of transfected cells forming stress fibers are graphed. Data represent the mean ± SD of three independent experiments. Tfx indicates transfection. **P < 0.01. (H) The focal adhesion numbers per cell of cells expressing GFP, ACTN1-GFP, and ACTN4-GFP were graphed. Data represent the mean ± SD of 130 cells for GFP, 52 cells for ACTN1-GFP, and 73 cells for ACTN4-GFP. *P < 0.05.

