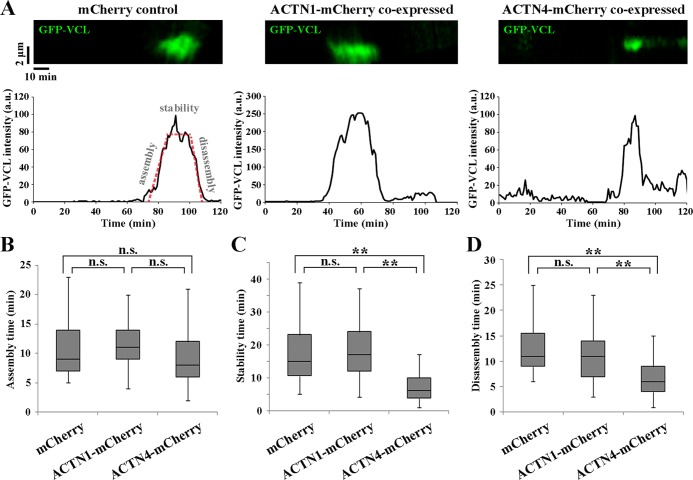
Fig 3. Turnover rate of focal adhesions in mCherry-, ACTN1-mCherry-, or ACTN4-mCherry-overexpressing DLD-1 cells.
(A) mCherry, ACTN1-mCherry, or ACTN4-mCherry were co-expressed with GFP-VCL and VCL time lapse image was observed by total internal reflection fluorescence (TIRF) microscopy to trace the assembly and disassembly of focal adhesions. Upper panels show representative kymographs of GFP-VCL fluorescence along 5-μm long lines drawn in regions of extending lamellipodia. Fluorescence intensity in the upper panel was plotted against time and shown as a graph to the bottom of respective kymographs. The turnover phases of focal adhesion assembly, stability, and disassembly are presented as red dashed lines in the mCherry vector graph. (B–D) Duration of each turnover phase exemplified in the left graph in A was analyzed and quantified from 51 adhesions for mCherry-expressing cells, 57 adhesions for ACTN1-mCherry-expressing cells, and 64 adhesions for ACTN4-mCherry-expressing cells. Data are presented as box and whisker plots with boxes representing 25th–75th percentile range and whiskers representing 10th–90th percentile range. n.s., not significant, **P < 0.01.

