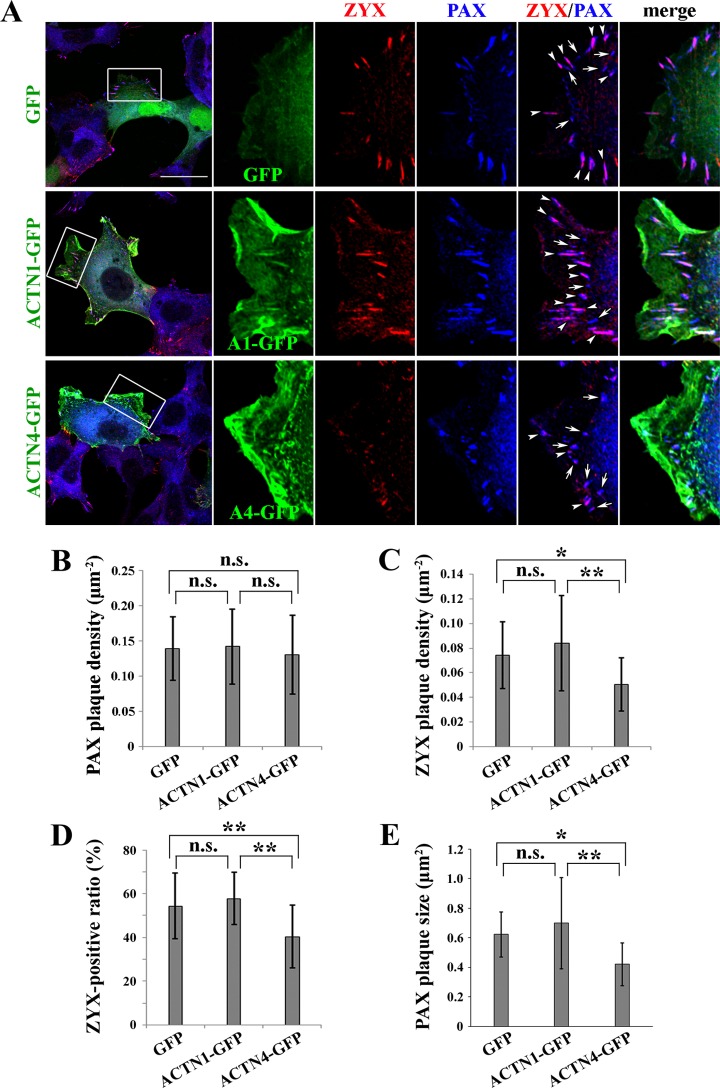
Fig 4. ZYX recruitment to focal complexes in ACTN1- or ACTN4-expressing DLD-1 cells.
(A) GFP, ACTN1-GFP, and ACTN4-GFP (shown in green) were expressed in DLD-1 cells, which were stained for PAX (blue) and ZYX (red) proteins and imaged under a confocal fluorescence microscope. Boxed regions in the leftmost column indicate the peripheral lamellae used for PAX and ZYX plaque quantification. A series of enlarged images of the boxed regions are shown to the right. The arrows and arrowheads indicate PAX-positive and PAX/ZYX-double-positive plaques, respectively. Scale bar = 30 μm. (B–C) Numbers of PAX and ZYX plaques per unit area of peripheral lamellae were counted in GFP-, ACTN1-, or ACTN4-expressing cells. Eight to sixteen cells were analyzed per group. Error bars refer to standard deviations between cells. n.s., not significant, *P < 0.05, **P < 0.01. (D) Ratio of ZYX-positive to PAX-positive plaques, i.e., total plaque adhesions. Error bars refer to standard deviations between cells. n.s., not significant, **P < 0.01. (E) PAX plaque size in GFP-, ACTN1- or ACTN4-expressing cells was measured in at least 171 adhesions from 8–11 cells per group. Error bars refer to standard deviations between cells. n.s., not significant, *P < 0.05, **P < 0.01.

