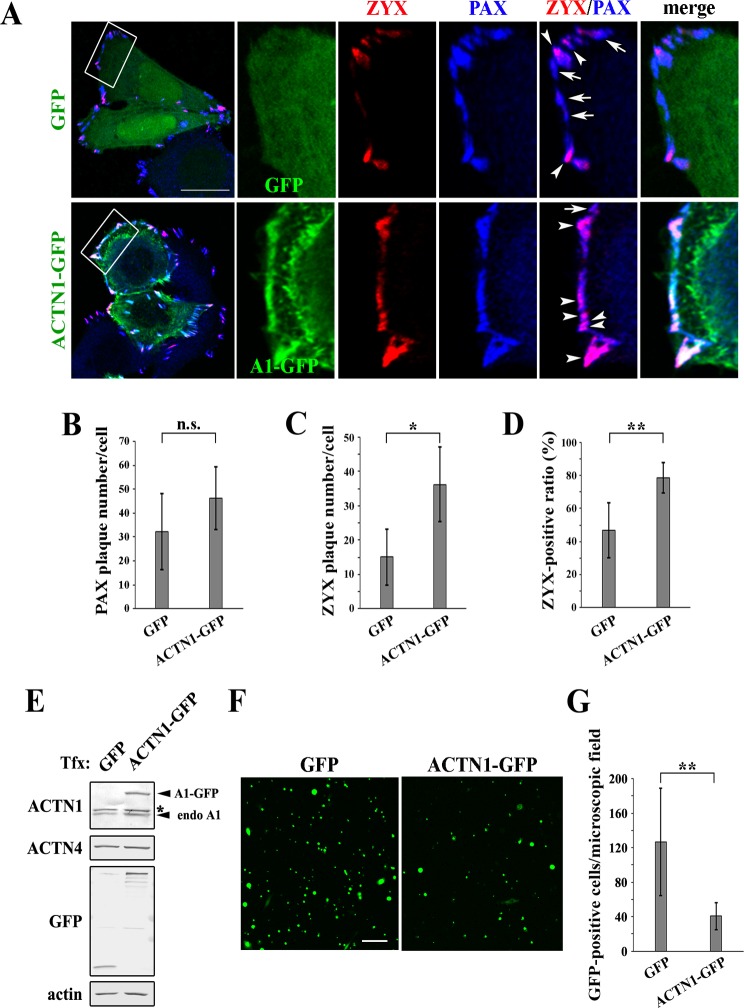
Fig 7. ACTN1 expression suppresses SW480 cell invasion.
(A) SW480 cells expressing GFP or ACTN1-GFP (shown in green) were stained for PAX (blue) and ZYX (red) proteins and imaged as described for Fig 4A. Boxed regions in the leftmost column are enlarged and shown to the right. The arrows and arrowheads indicate PAX-positive and PAX/ZYX-double-positive plaques, respectively. Scale bar = 20 μm. (B–C) Numbers of PAX and ZYX plaques per cell were counted in GFP- or ACTN1-GFP-expressing cells. At least 66 cells were analyzed per group. Error bars refer to standard deviations between cells. n.s., not significant, *P < 0.05. (D) Ratio of ZYX-positive to PAX-positive plaques. Error bars refer to standard deviations between cells. **P < 0.01. (E) SW480 cells were transiently transfected with GFP or ACTN1-GFP, and protein expression was analyzed by western blotting using the antibodies indicated to the left of each blot. Tfx indicates transfection. The asterisk indicates a non-specific crossreacting band. (F) The invasion assay was performed using GFP- or ACTN1-GFP-expressing SW480 cells as described in the legend to Fig 6B. Invaded cells were fixed and imaged by GFP fluorescence. Scale bar = 100 μm. (G) The GFP-positive cells shown in (F) were quantified as described in the legend to Fig 6C. **P < 0.01.

