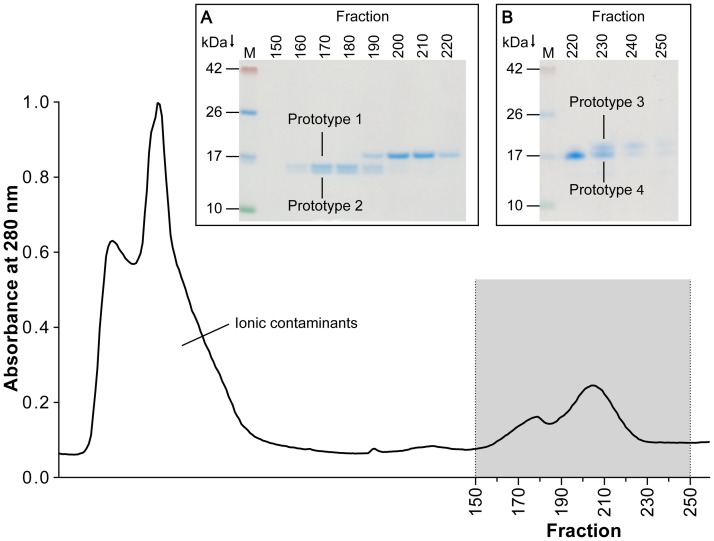
Fig 2. Representative elution profile of oil body proteins separated by preparative electrophoresis monitored at 280 nm.
Electrophoresis was performed with extracted oil body proteins on a 10% polyacrylamide resolving gel, and fractions of 2 mL were collected. Fractions corresponding to the main peaks were visualized by SDS-PAGE on 12% polyacrylamide gels with Coomassie staining (Insert). M, marker; (A) Fraction 150–220 (B) Enriched (5:1) fractions 220–250, for prototype classification see Table 1.

