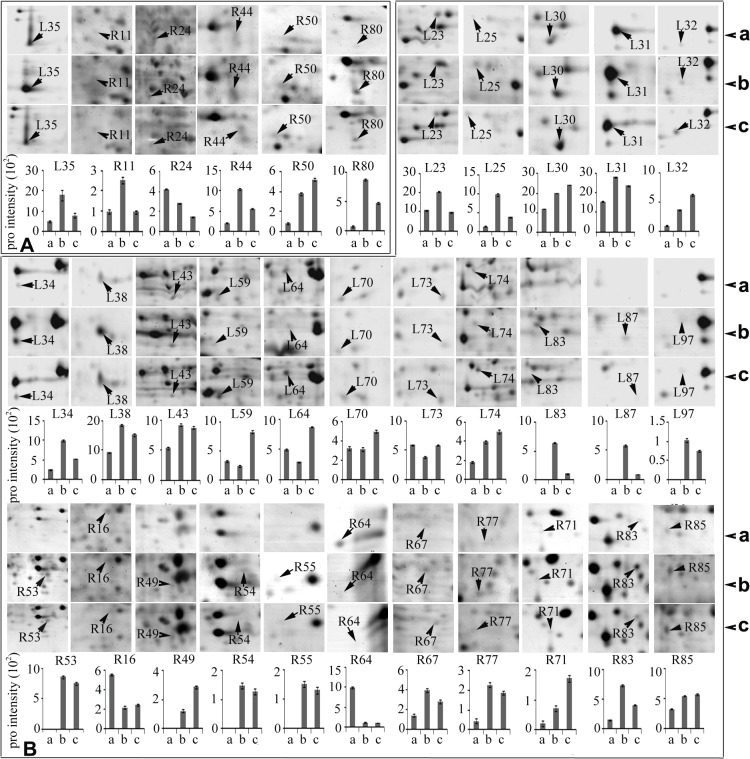
Fig 4. Differentially changed proteins associated with signal transduction (A) and antioxidation and defense (B) in leaves and roots of T. boeoticum plants exposed to 20% PEG6000 for 48 h to induce drought stress.
All protein spots are enlarged from S1A–S1F Fig and protein intensity values are from S2 and S3 Tables. a, b, c represent 0, 24, and 48 h of drought treatment, respectively. Protein spot identities correspond to those in S1 Fig and S2, S3, S4, and S5 Tables. Error bars represent standard deviation (n = 3).

