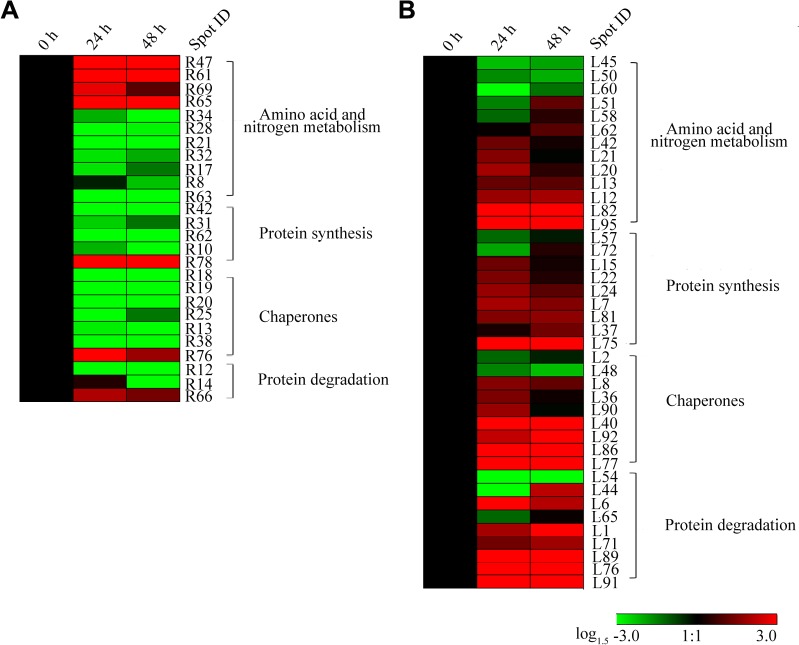
Fig 7. Hierarchical clustering of drought stress-responsive proteins associated with amino acid and protein metabolism in T. boeoticum roots (A) and leaves (B).
A hierarchical cluster analysis was conducted using the Genesis software package version 8.2 1.7.6 (Graz University of Technology, Austria, http://genome.tugraz.at/genesisclient/genesisclient_download.shtml) and the log1.5-transformed values of fold-change ratios listed in S7 Table. Protein spot identities correspond to those in S1 Fig and S2, S3, S4, and S5 Tables. The annotations of individual proteins are listed in S4 and S5 Tables.

