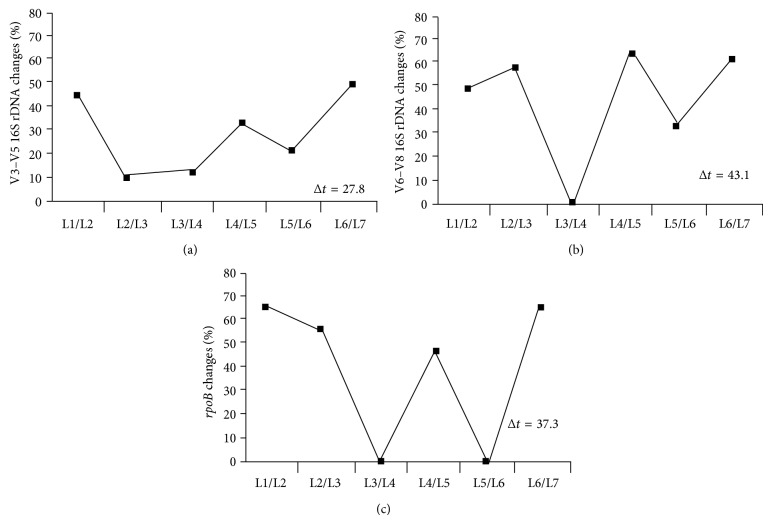
Figure 2.
Moving window analyses (MWA) and rate of change (Δt) values to evaluate the level of dynamics of the bacterial community during ATAD treatment. Primer sets were targeted to the V3–V5 and V6–V8 regions of the bacterial 16S rDNA and rpoB gene sequences. L1 thickened sludge, L2 Reactor 1A (after 4 hours), L3 Reactor 1A (after 8 hours), L4 Reactor 1A (after 16 hours), L5 Reactor 2A (after 4 hours), L6 Reactor 2A (after 23 hours), and L7 product (biosolids after treatment). Values were calculated as described in Section 2.

