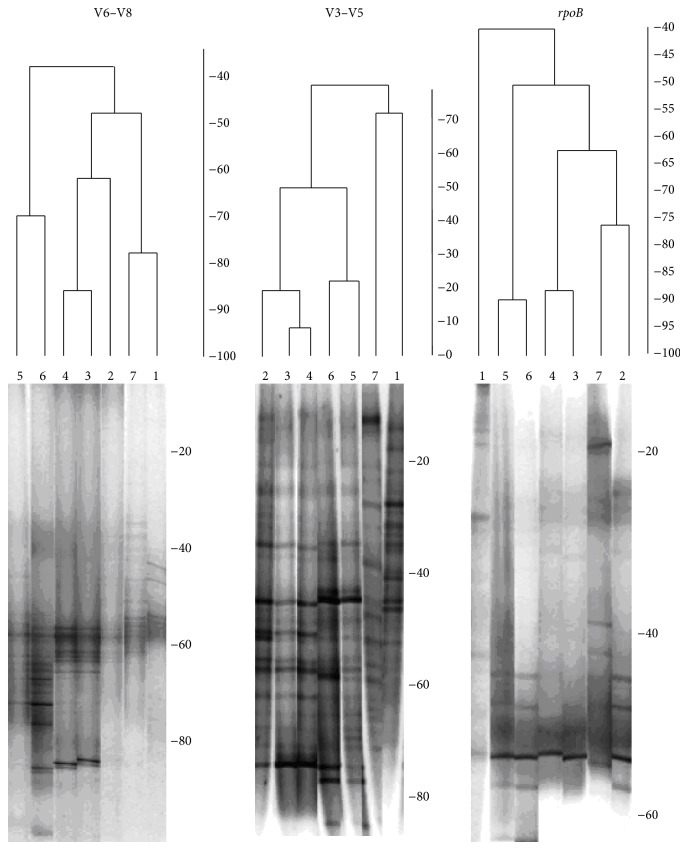
Figure 3.
UPGMA dendrogram of DGGE profiles of amplified 16S rDNA of the total bacterial community from ATAD sludge obtained at different stages of the ATAD process using BioNumerics 4.0 software advanced analysis package. The fingerprints were obtained with primers amplifing the V6–V8 and V3–V5 regions of 16S rDNA and the rpoB gene. The cluster tree images are aligned alongside. Lane 1: thickened sludge, Lane 2: Reactor 1A (after 4 hours), Lane 3: Reactor 1A (after 8 hours), Lane 4: Reactor 1A (after 16 hours), Lane 5: Reactor 2A (after 4 hours), Lane 6: Reactor 2A (after 23 hours),and Lane 7: product (biosolids after treatment).

