
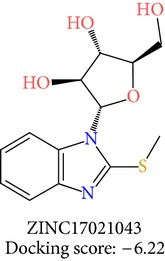
Table 3.
2D structures of selected hits with docking scores in kcal/mol.
| Cluster 1 | Cluster 2 | Cluster 3 |
|---|---|---|

|

|

|

|
|

|

|

|

|
Official websites use .gov
A
.gov website belongs to an official
government organization in the United States.
Secure .gov websites use HTTPS
A lock (
) or https:// means you've safely
connected to the .gov website. Share sensitive
information only on official, secure websites.
2D structures of selected hits with docking scores in kcal/mol.
| Cluster 1 | Cluster 2 | Cluster 3 |
|---|---|---|
|
|
|
|
|
|
|
|
|
|
|
|