
Figure 1.
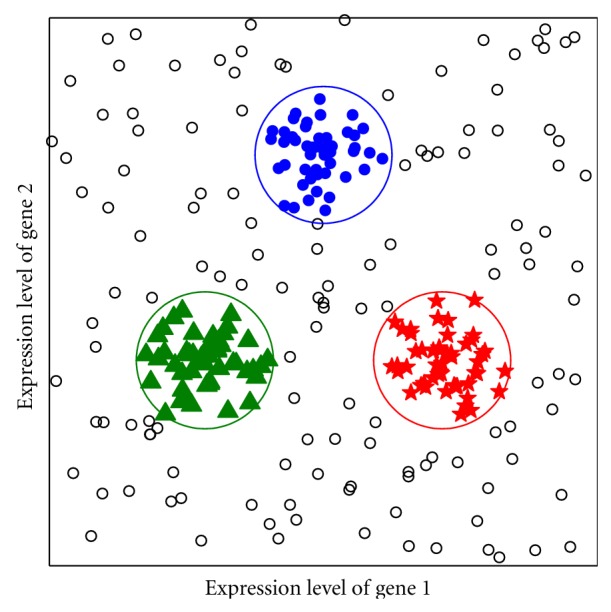
The layout of the point cloud associated with a “schematic” cancer represented by expression levels X 1 and X 2 of two genes. The point cloud is distributed randomly but contains three closely packed “pockets,” each of which is assumed to consist of “core” samples of a specific subtype of the malignancy.