
Figure 14.
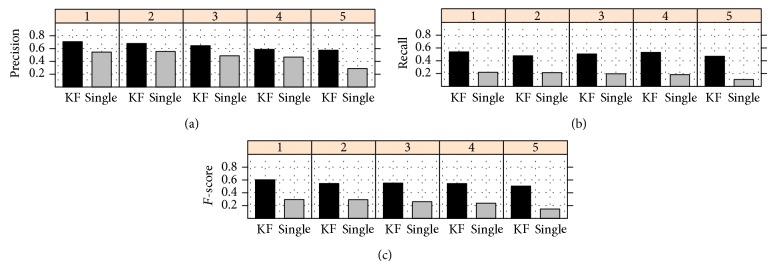
Comparison of per level average precision, recall, and F-score across the five levels of the FunCat taxonomy in HBAYES-CS using single data sets (single) and kernel fusion techniques (KF). Performance of “single” is computed by averaging across all the single data sources.