
Figure 6.
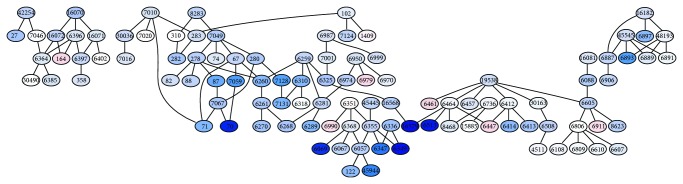
Improvements induced by the hierarchical prediction of the GO terms. Darker shades of blue indicate largest improvements, and darker shades of red indicate largest deterioration; white means no change (adapted from [20]).
Official websites use .gov
A
.gov website belongs to an official
government organization in the United States.
Secure .gov websites use HTTPS
A lock (
) or https:// means you've safely
connected to the .gov website. Share sensitive
information only on official, secure websites.
Improvements induced by the hierarchical prediction of the GO terms. Darker shades of blue indicate largest improvements, and darker shades of red indicate largest deterioration; white means no change (adapted from [20]).