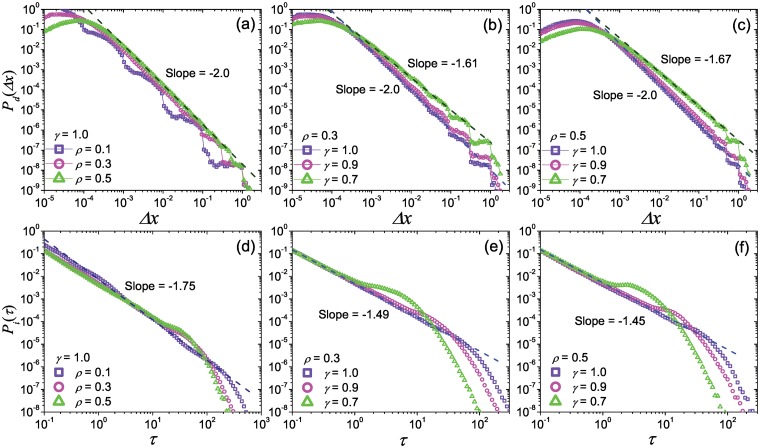
Fig 3. The displacement distributions and the inter-visit time distributions.
Panels (a), (b) and (c) are respectively the displacement distributions generated by the present model with different parameters ρ and γ, as well as panels (d), (e) and (f) for the inter-visit time distributions. The result is averaged by 103 independent runs. The dark blue dashed lines and dark green dashed lines respectively corresponds to the fitting lines of the data signed by light blue squares and light green rectangles.

