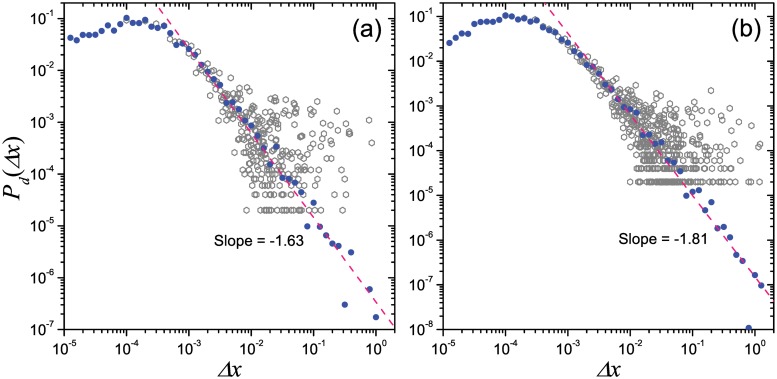
Fig 4. Two examples of the displacement distributions of single walker in single run.
Panels (a) and (b) respectively correspond to the simulation shown in Fig 2(c) and 2(d), and blue dots and grey hexagons respectively show the log-binning distribution and its original form, and the pink dashed lines shows the fitting power law curves.

