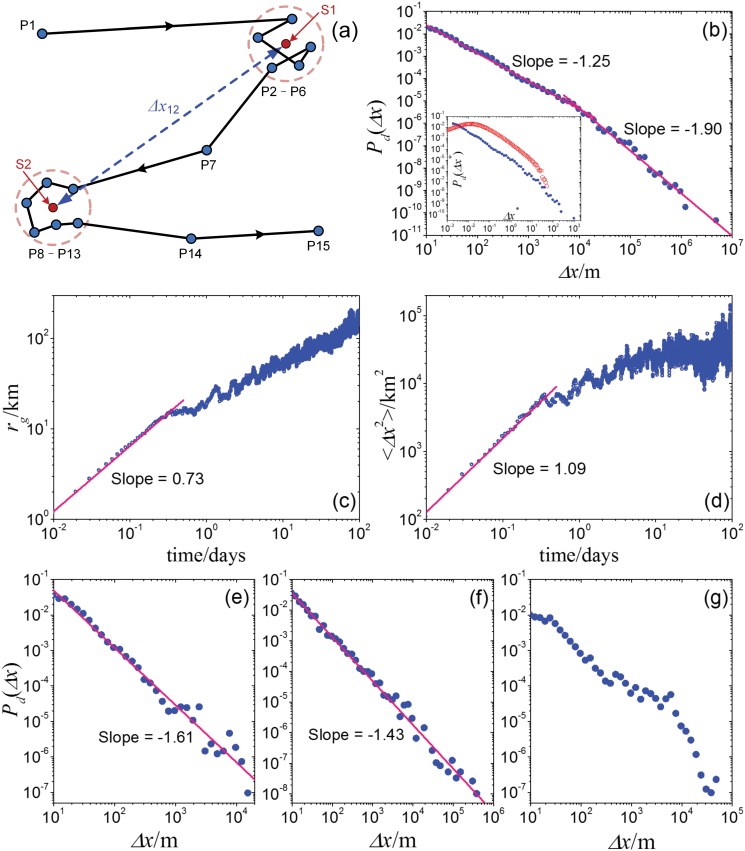
Fig 7. Empirical results of the analysis on GPS records.
(a) Illustration of the distinguishing on effective staying positions. (b) The log-binning aggregated displacement distribution P d(Δx), and the inset shows the displacement distributions P d(Δx*) of the unified displacement Δx* = Δx/⟨Δx⟩ for the empirical results (the blue dots) and the modeling results under parameter settings ρ = 0.66, γ = 0.54, and λ = 0.5 (the red hexagons). Panels (c) and (d) respectively show the gyration radius and MSD of the 32 users in aggregated level, and the unit respectively are kilometer (km) and square kilometer (km2). Panels (e), (f) and (g) show the log-binning displacement distributions of three of the 32 users, and the unit of displacement is meter (m).

