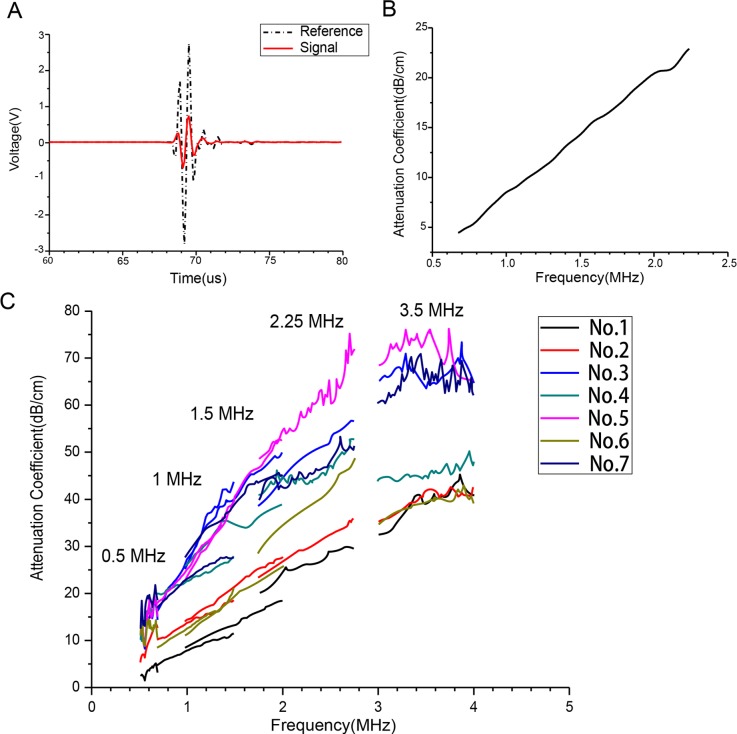
Fig 2. Relationship Between Attenuation and Frequency.
(A) Reference signal(dashed line) and signal transmitted through bone(solid line) for the 1.5-MHz center-frequency transducer pair on specimen 1. (B) Relationship between attenuation and frequency for the 1.5-MHz center-frequency transducer pair on specimen 1. (C) Relationship between attenuation and frequency for 5 transducer pairs on 7 specimens.

