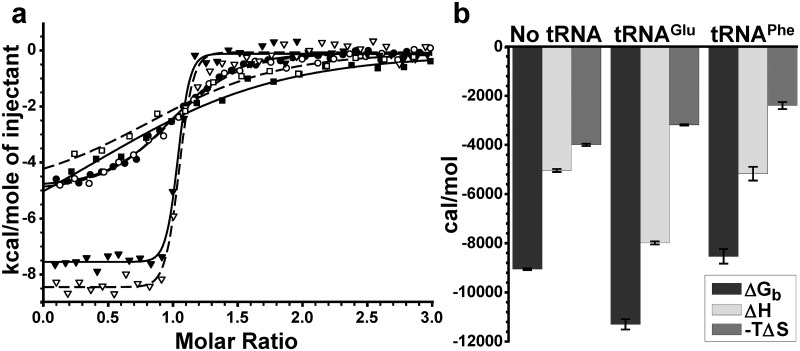
Fig 2. Glu-AMS binding to GluRS with/without tRNA.
(a) Integrated ITC curves of Glu-AMS binding to GluRS with/without tRNA. Binding of Glu-AMS: to GluRS alone (circles), to GluRS with saturating concentration of tRNAGlu in enriched total tRNA from E. coli (upside-down triangles), to GluRS with 11.23 µM tRNAPhe from brewer’s yeast (squares). A duplicata of each tested condition is shown. The values shown in (b) were calculated from means of two distinct experiments reported in Table 1, weighting by inverse variance [32].

