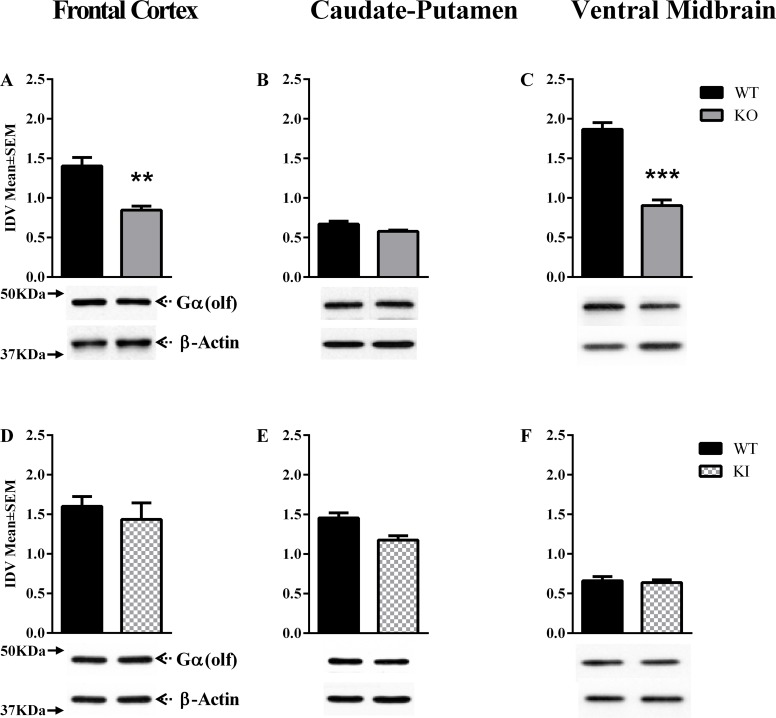
Fig 3. Gα(olf) and Gα(s) expression at P60.
Gα(olf) and Gα(s) expression in the frontal cortex, caudate-putamen and ventral midbrain of Dyt1 KO, and, Dyt1 KI mice at postnatal day 60 (P60; A-F). In each panel, the upper band shows Gα(olf) (A-F), and the lower band shows β-actin, which was used as a loading control. The bar graphs in each panel represent Gα(olf) band intensity (mean ± SEM) normalized to intensity of loading control (integrated density value; IDV). The names of the mouse lines (Dyt1 KO, Dyt1 KI) are indicated to the right (**p<0.01, ***p<0.001; n = 3 or 4).

